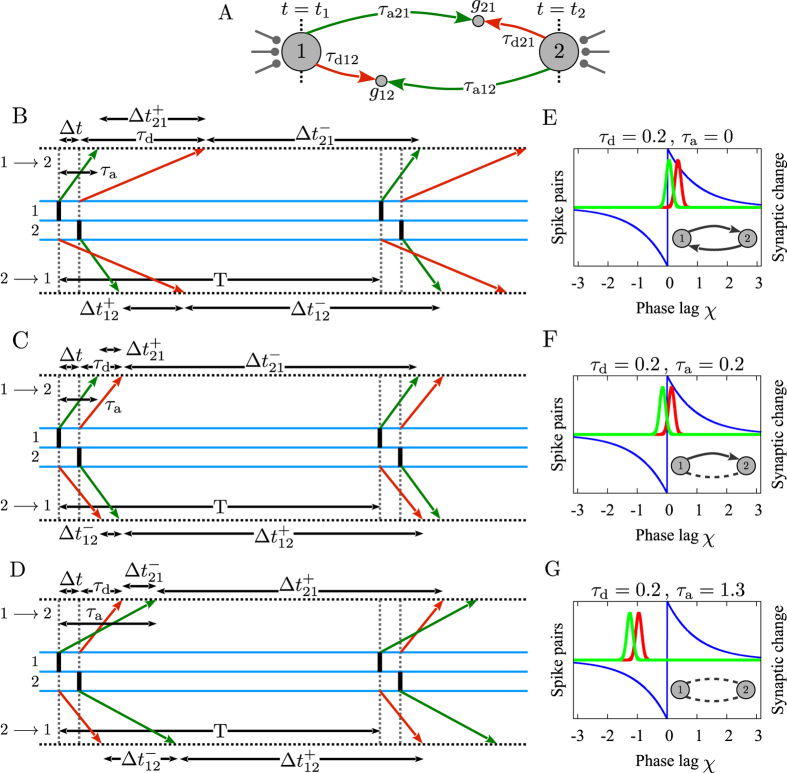
Figure 1. Possible synaptic modifications of two interconnected neurons fire nearly inphase in the presence of dendritic and axonal propagation delays.
(A) Two representative identical neurons which are reciprocally coupled by initially symmetric excitatory synapses. t1 and t2 are the exact spiking times of neurons 1 and 2, respectively. gij, τdij and τaij, i, j = 1, 2, j ≠ i denote synaptic strength, dendritic and axonal propagation delays of the synapse j → i, respectively. (B–D) Assuming dendritic and axonal delays are identical in both directions i.e. τd21 = τd12 = τd and τa21 = τa12 = τa,  is the effective time lag for which STDP causes synaptic potentiation (upper)/depression (lower sign) of the corresponding synapse (horizontal dotted lines). T is the period of the spiking of the neurons. The vertical bars in the middle triple lines indicate spiking of the neurons. Green and red arrows represent the time of the transmission of the spike of the presynaptic neuron and the backpropagated potential of the postsynaptic neuron to the synaptic site, respectively. (B) Potentiation of both synapses in case τa < |Δt − τd|. (C) Formation of unidirectional connection when |Δt − τd| < τa < |Δt + τd|. (D) Depression of both synapses in case that |Δt + τd| < τa. (E–G) Illustration of corresponding synaptic modifications based on a balanced STDP profile and the schematic Gaussian distribution of pre (green)- and postsynaptic (red curve) spike times for different exemplary values of dendritic and axonal propagation delays used in our simulations.

