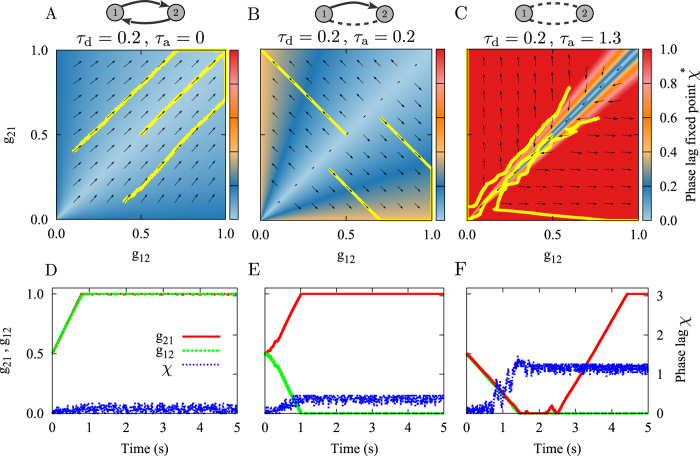
Figure 3. Theoretical prediction of synaptic modifications.
(A–C) The colors show the phase lag of spiking of the neurons derived from equation (2) and the vector field shows the direction of the change in synaptic strengths from equation (3). The yellow curves denote the simulated synaptic evolution for three different initial values. Based on the delay times the emergent structure can be a bidirectional connection (A), unidirectional connection (B), or the neurons are decoupled (C). (D–F) Time course of simulated synaptic strengths (green and red) and phase lag (blue) with the same parameters used in panels (A–C), respectively. The dendritic propagation delay is fixed at τd = 0.2. STDP parameters are A+ = A− = 0.005, and τ+ = τ− = 1. The initial values of the synaptic strengths are g21(0) = g12(0) = 0.5.

