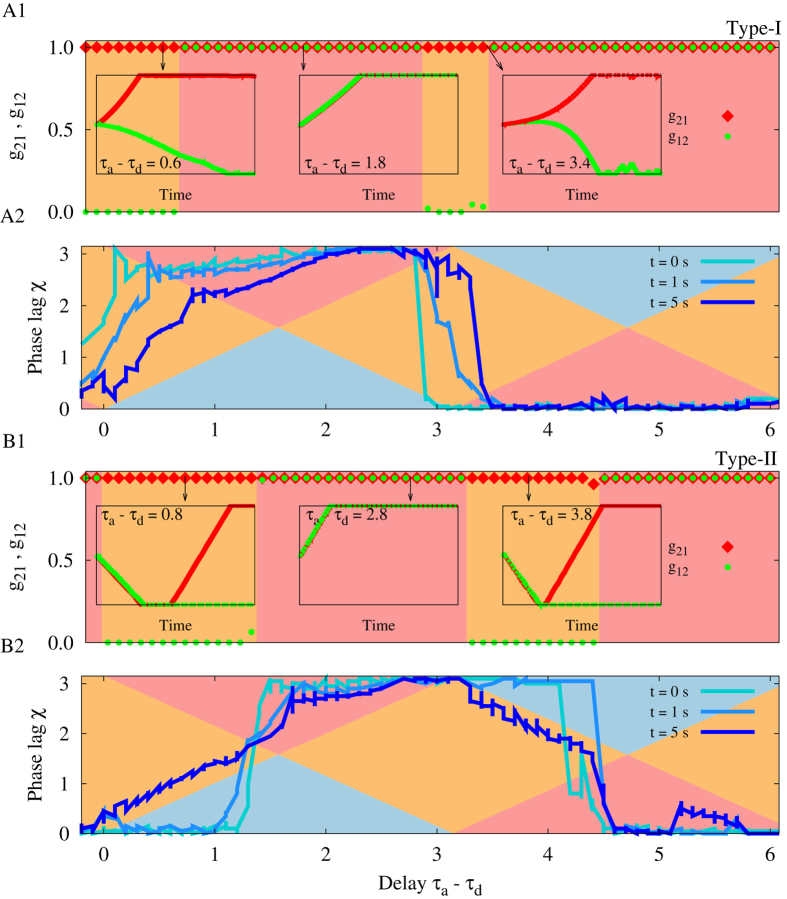
Figure 4. The role of the type of excitability and the PRC of neurons in the evolution of synaptic strengths.
(A1,B1) Show the simulation results for final synaptic strengths vs. difference of dendritic and axonal propagation delays for typical type-I (A1) and type-II (B1) neurons. The red and green signs show the final values of the synaptic strengths and the background colors illustrate whether a unidirectional (orange) or bidirectional (red) configuration is formed. In the insets three different time courses of the synaptic strengths are shown and in particular it is shown that initial depression of both synapses ultimately leads to a unidirectional configuration. (A2,B2) Three snapshots of the time lag of spiking have been shown. Background colors are those in Fig. 2 showing the theoretical prediction of the evolution of the synaptic strengths. If the phase lag (sequential blue curves) lies in the range with orange, red, and blue background color; a unidirectional, bidirectional, and decoupled structure is expected, respectively. If the time lag crosses the intersection of the regions, the direction of the evolution of the synapses changes as is shown in the leftmost inset plot of (B1). In the simulations the dendritic propagation delay is fixed at τd = 0.2. STDP parameters are A+ = A− = 0.005, and τ+ = τ− = 1. The initial values of the synaptic strengths are g21(0) = g12(0) = 0.5.

