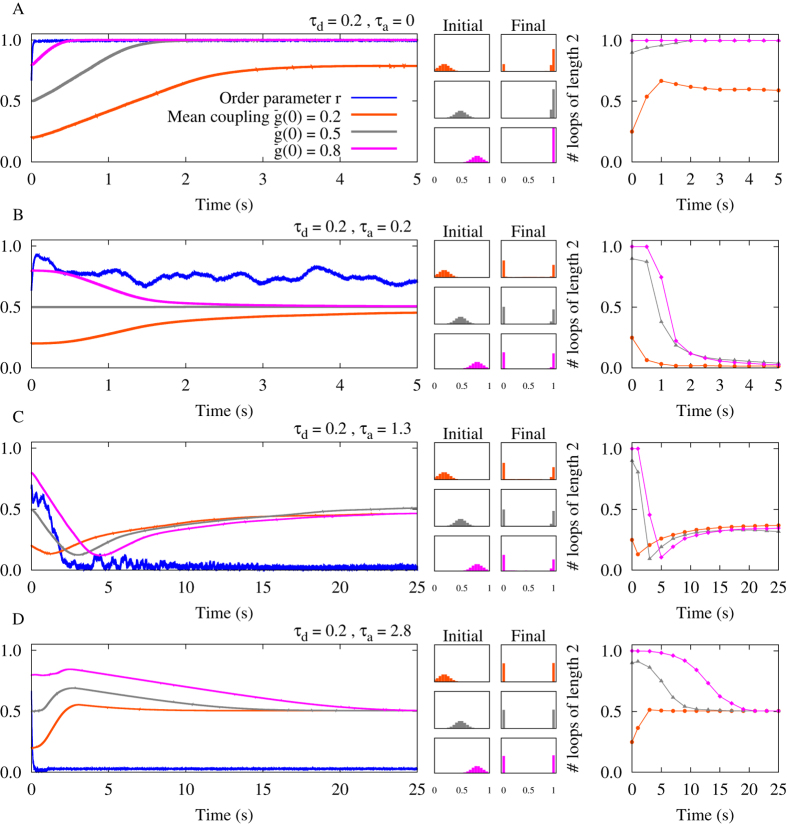
Figure 5. Simulation results for a network of N = 100 type-II phase oscillators.
Left panels show the order parameter and three different mean couplings belonging to different distribution of synaptic strengths. Middle panels denote corresponding initial distributions: Gaussian distribution around the mean value  with standard deviation 0.1, and final distribution of synaptic strengths. Right panels indicate the time course of the normalized number of closed loops of length 2 representing the number of bidirectional connections in the network (see Methods). (A) Inphase firing. Different distributions of synaptic strength lead to a collective potentiation of the synaptic strengths. The number of loops reaches its maximum value. (B) Nearly inphase firing. STDP eliminates strong recurrent loops between neurons and leads to unidirectional connections. (C) All connections are decoupled and loops are eliminated. (D) Antiphase firing. STDP potentiates recurrent loops while weakening the other connections. In the simulations, the initial values of phases are uniformly distributed between 0 and π. The dendritic propagation delay is fixed at τd = 0.2. STDP parameters are A+ = A− = 0.005, and τ+ = τ− = 1.

