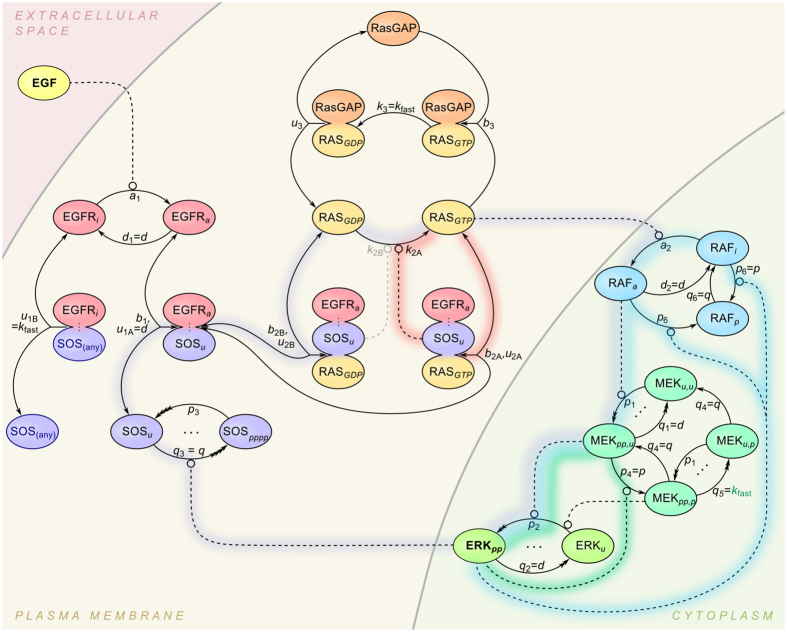
Figure 2. Model for MAPK signaling.
Reactions considered in the model are represented by lines with arrowheads. Multiple arrowheads denote reactions with multiple steps (e.g., multi-site phosphorylation of SOS by ERK). Positive influences (e.g., ERK-catalyzed phosphorylation of SOS) are indicated by lines attached to small circles, with the circles identifying the reactions affected. The reactions and influences responsible for various feedback mechanisms are highlighted with shading: RAS-to-SOS positive feedback (red shading), ERK-to-SOS negative feedback (purple shading), ERK-to-MEK negative feedback (green shading), and ERK-to-RAF negative feedback (blue shading). Tripartite arrows, labeled with both binding and unbinding rate constants, are used to represent association and dissociation reactions.

