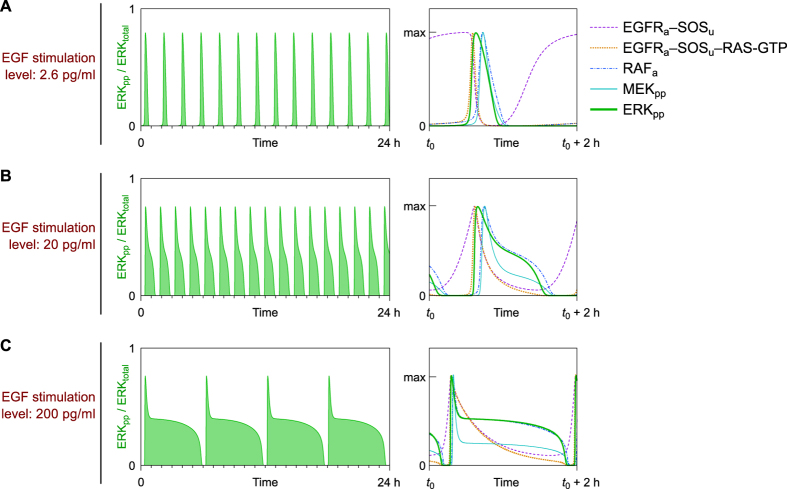
Figure 4. Simulated trajectories for three EGF stimulation doses.
The active ERK fraction (left column) together with levels of EGFRa–SOSu complexes, EGFRa–SOSu–RAS-GTP complexes, RAFa and MEKpp normalized to their maxima (right column) are shown as a function of time after stimulation by (A) low, (B) intermediate, and (C) high doses of EGF.

