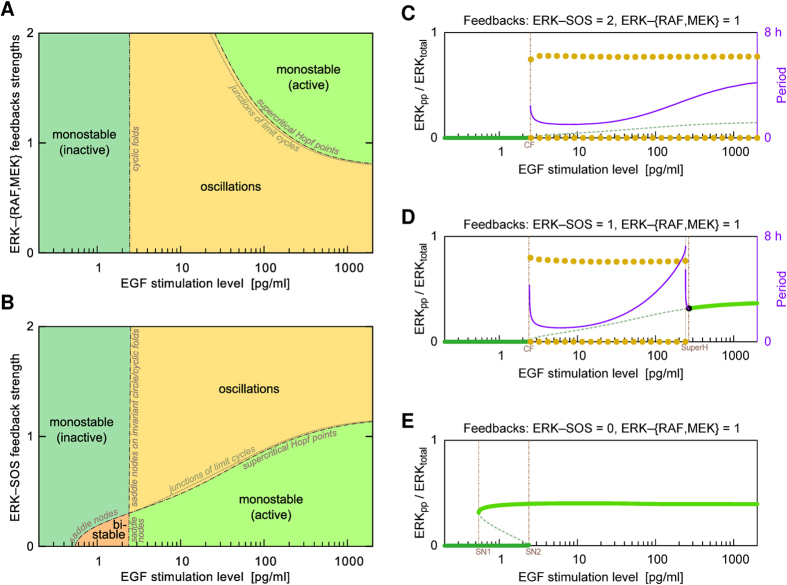
Figure 5. Bifurcation diagrams.
Each plot indicates the recurrent solutions for the fraction of activated ERK (ERKpp/ERKtotal) as a function of either one or two bifurcation parameters. EGF dose (or stimulation level) is a bifurcation parameter in each plot. In the two-dimensional bifurcation diagrams, the second bifurcation parameter characterizes the strength of the negative feedbacks from ERK to RAF and MEK (A) and the strength of the negative feedback from ERK to SOS (B). Areas are colored to indicate distinct qualitative behaviors: oscillatory, monostable with low or high ERK activity, and bistable. The boundaries are labeled to indicate the bifurcation types that separate the different regimes of behavior. The one-dimensional bifurcation diagrams correspond to different strengths of the negative feedback from ERK to SOS (i.e., they correspond to different cross-sections of the parameter space of panel B): twice the default strength (C), the default strength (D), and absent (E). Solid green lines indicate stable steady states; dashed green lines indicate unstable steady states. Yellow dots indicate the upper and lower envelopes of stable limit cycles. Purple lines indicate the periods of oscillations. Cyclic fold (CF) bifurcations in panels C and D are accompanied by subcritical Hopf bifurcation points (not marked). In a tiny parameter region between the two bifurcation points there coexist a stable limit cycle, an unstable limit cycle, and a stable steady state. In panel D, supercritical Hopf bifurcation lies close to a series of complex bifurcations (seen as the period discontinuity) which effects in a junction of limit cycles.

