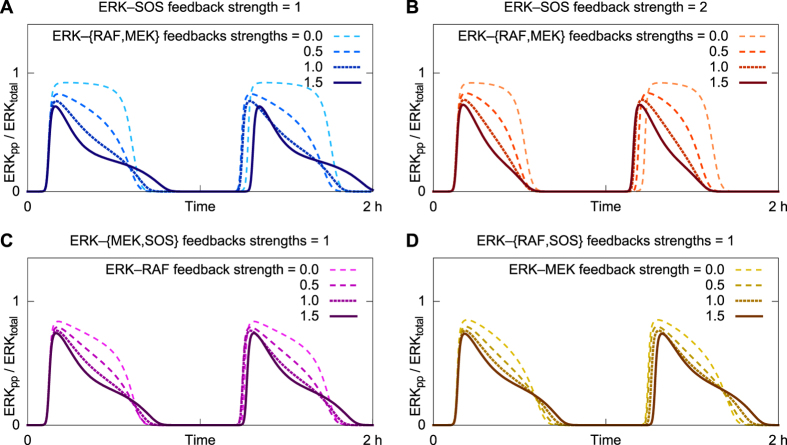
Figure 6. Negative feedback from ERK to MEK and RAF shape the time profile of response to EGF stimulation at 10 pg/ml.
Each time course illustrates an oscillatory response to EGF stimulation. In the top panels, the strength of ERK-to-SOS negative feedback is set at the default level (A) or twice the default level (B). In these panels, different dash patterns correspond to different strengths of feedback from ERK to MEK and RAF, as indicated in the legends. The ERK-to-MEK and ERK-to-RAF feedback strengths are taken to be equal. In the bottom panels, the ERK-to-MEK and ERK-to-RAF feedback strengths are varied separately, as indicated in the legends.

