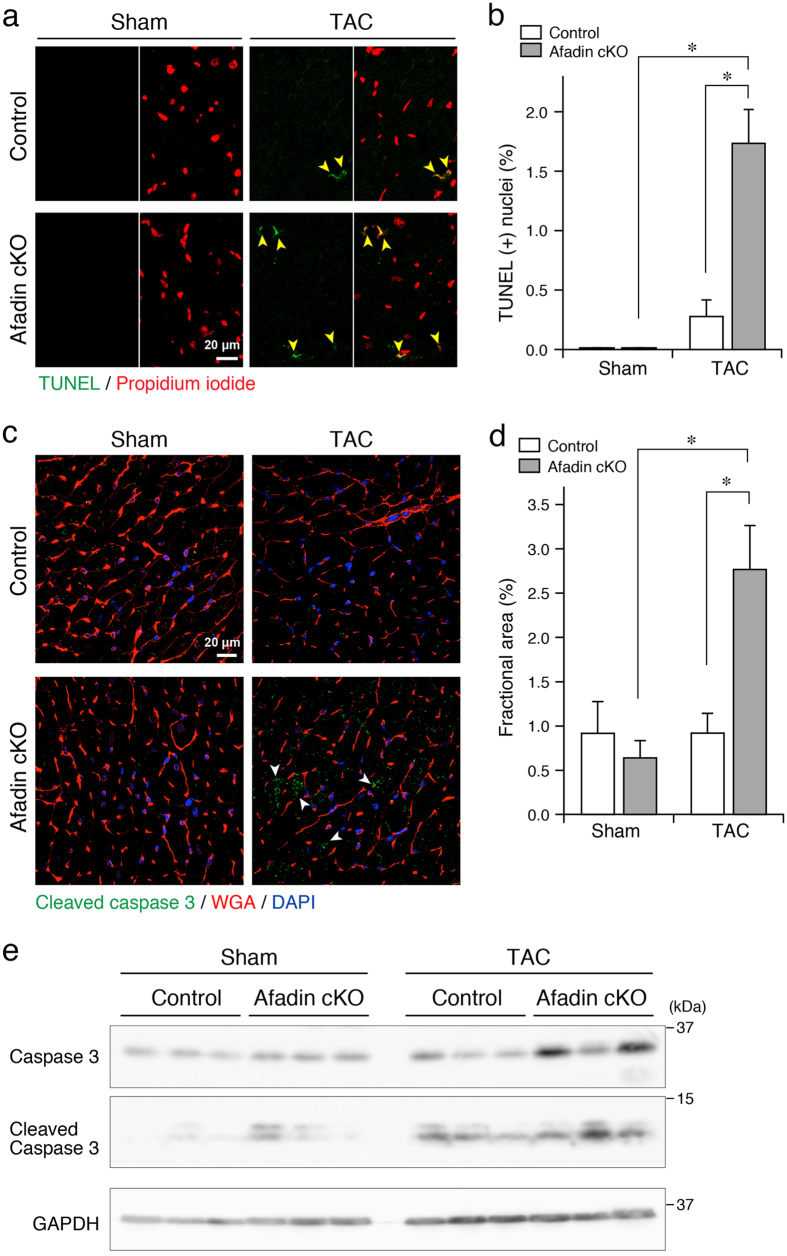
Figure 3. Cellular markers for apoptosis in TAC-exposed mouse hearts.
(a) Confocal images showing TUNEL-positive apoptotic nuclei (green) among the scanned nuclei stained with propidium iodide (red) in all groups. Yellow arrowheads: TUNEL-positive cells. (b) Summary graph presenting percentage of TUNEL-positive nuclei, which was estimated per 1000 nuclei in each group. *p < 0.05. (c) Immunostaining of cleaved caspase 3 (green). Wheat germ agglutinin (WGA: red) staining for the surface membrane of cardiomyocytes, and DAPI (blue) staining for the nuclei. White arrowheads: cleaved caspase 3-positive areas. (d) Summary graph presenting percentage of cleaved caspase 3-positive area. *p < 0.05. (e) Western blots for detection of cleaved caspase 3 in the protein samples from sham- and TAC-operated hearts for 8 weeks (n = 3 in each group). GAPDH: loading control.

