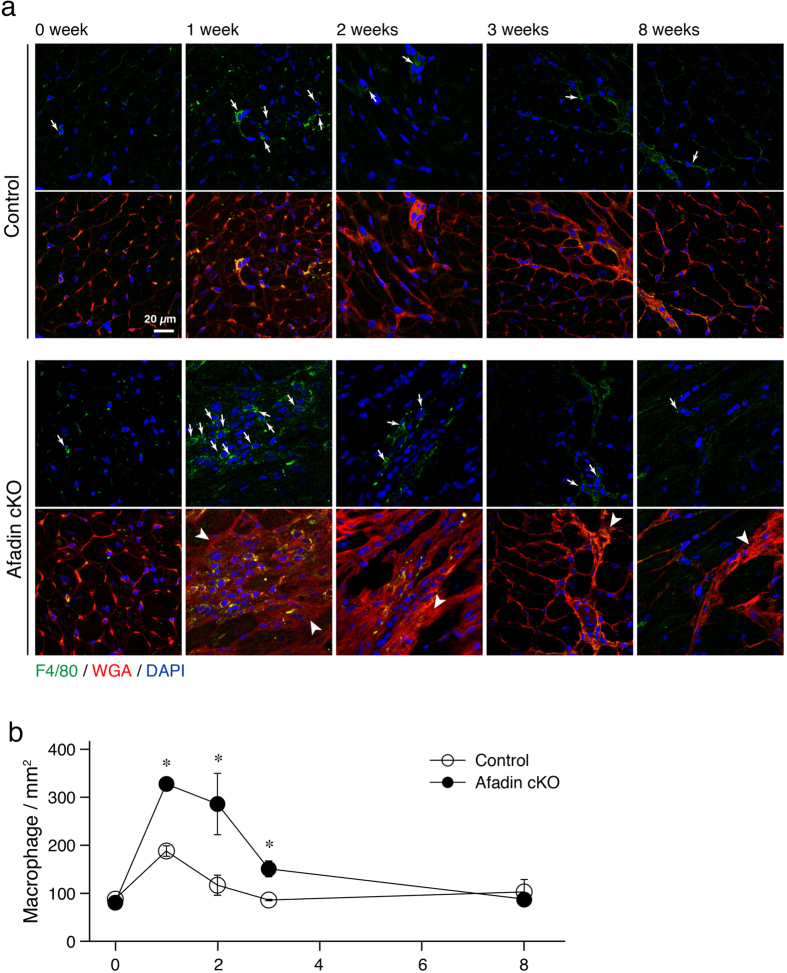
Figure 4. Inhibition of early inflammatory reaction by afadin after TAC operation.
(a) Confocal images demonstrating infiltration of myocardium with F4/80-positive cells (green) in the time series of untreated (0 week), 1, 2, 3, and 8 weeks exposure to chronic pressure overload induced by TAC procedure. Wheat germ agglutinin (WGA: red) staining for the cell membranes, and DAPI (blue) staining for the nuclei. Arrows: F4/80-positive infiltrating cells, Arrowheads: disturbed myocardial structure. (b) Summary graph for quantification of F4/80-positive cells. *p < 0.05 vs control.

