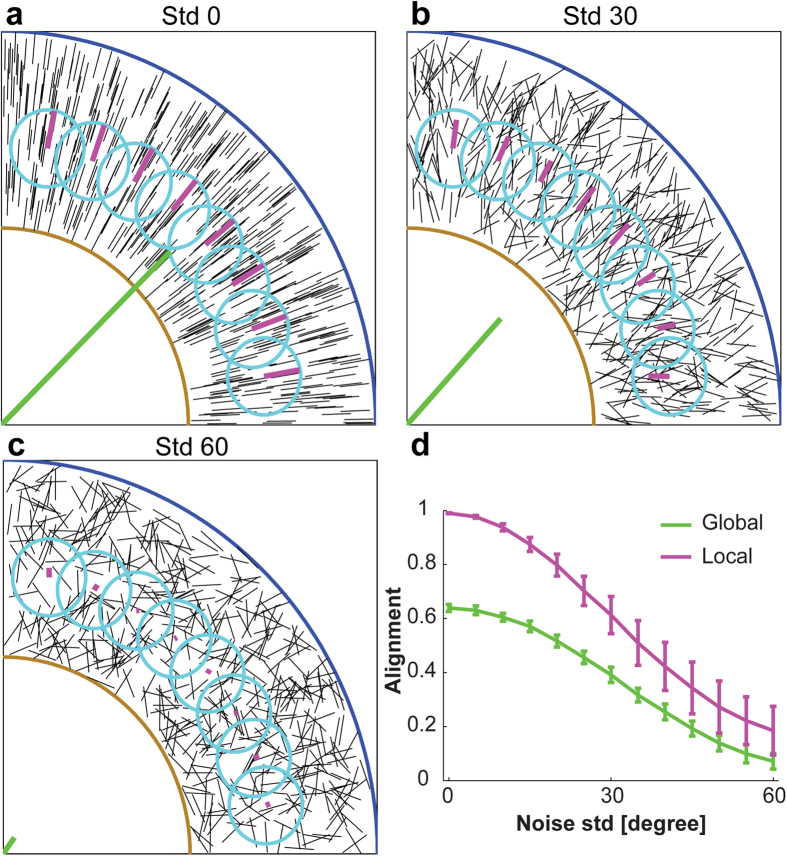
Figure 2. Global vs. local alignment vectors for radially aligned in silico fibers normal to a circular boundary (brown).
The simulation box is 512 × 512, contains 500 fibers with length equal to 40. Starting from all fibers that are radially aligned to the circular boundary, we perturb the direction by adding an angle, sampled from a normal distribution with zero mean and the standard deviation (std) of (a) 0 degree, (b) 30 degree, and (c) 60 degree. The global alignment vector (green) was calculated for all fibers in the simulation box (or within the blue global circle), and the local alignment vector (magenta) were calculated for the fibers inside of 8 local circles (cyan). (d) Comparison between global and local alignment measurement. Error bars are standard deviations from 100 independent replicas of 500 in silico fibers with angular perturbations of std = 0 to std = 60 for every 5 degree increment.

