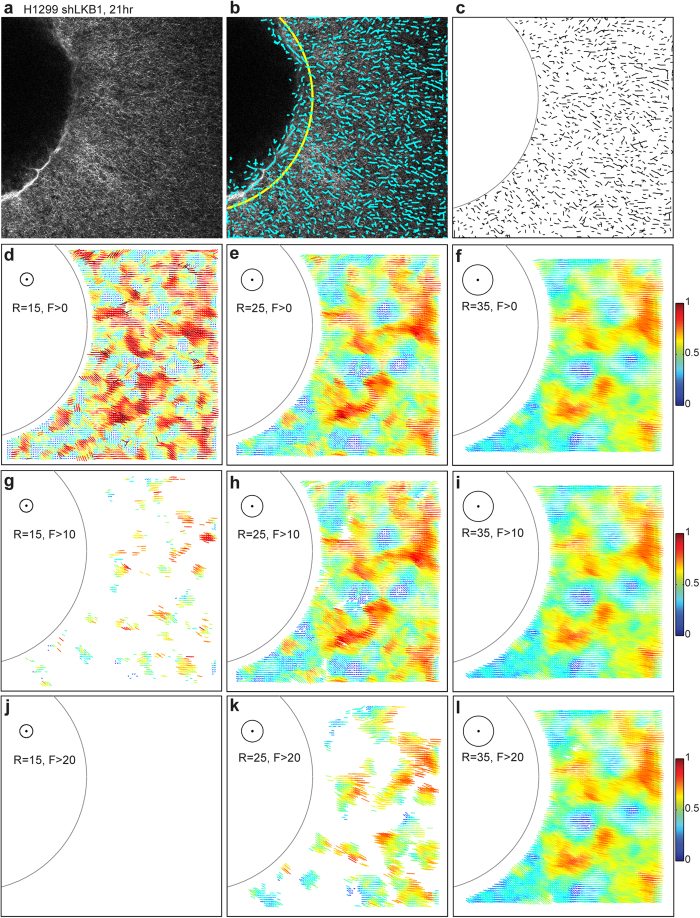
Figure 3. Local alignment vector of H1299 shLKB1, the first z stack image (the bottom of a collagen gel) at 21 hour.
The image size is 512 × 512 pixels, and each pixel is 0.83 μm. (a) Multiphoton microscopy image using the second harmonic generation signals, (b) Extracted fiber segments (cyan color) using CT-FIRE. A circular tumor boundary (yellow) is manually selected. (c) Quantized fiber segments. (d–l) local alignment vectors for varying two different parameters: local circle size (the circle radius, R = 15, 25, 35 pixel) and minimum fiber segment number (F > 0, 10, 20). Inset figures illustrate each local circle and two different parameters. A colorbar is attached to show color-coded alignment vectors, where the alignment vector length changes from 0 to R in each figure, and the alignment value changes from 0 to 1 after the local circle is converted to the unit circle.

