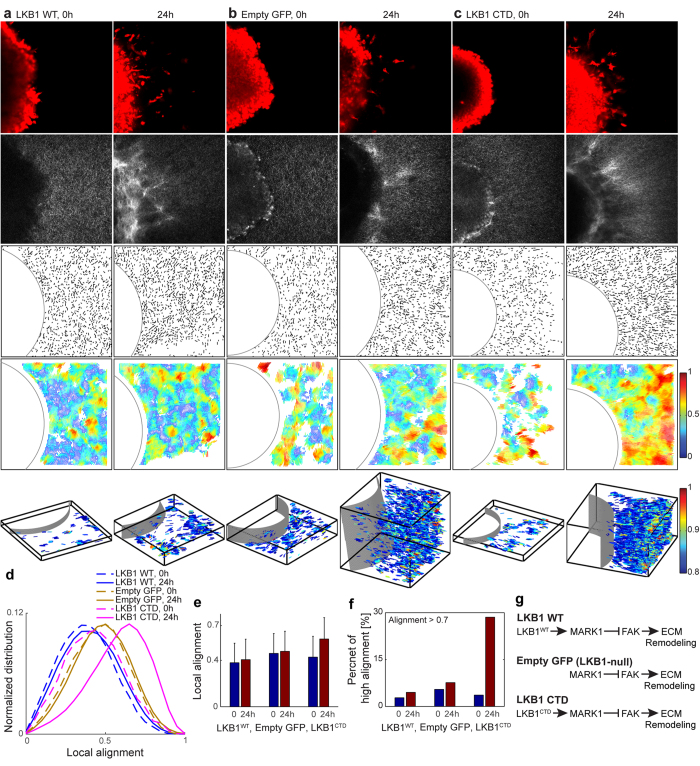
Figure 5. Local alignment vector analysis of in vitro H157 tumor spheroids in a collagen gel.
Spheroids of (a) LKB1WT, (b) Empty GFP (LKB1-null), (c) LKB1CTD (C terminal domain only) are imaged at 0 and 24 hours after seeding into a 2 mg/ml collagen gel. The first row in (a–c) are fluorescent microscopy images of tumor spheroids, dyed using CellTracker Red; the second row are SHG images of collage fibers; the third row is quantized fiber segments with manually selected circular tumor boundary after extracting collagen fibers using CT-FIRE; the fourth row is the local alignment vectors. These 2D fiber images are the first z stack images (the bottom of collagen gel). The fifth row are local alignment vectors of all z stacks in 3D, where we plot only the high alignment vectors (alignment > 0.8). For clear visualization, scale in Z is magnified 4 times, i.e., X:Y:Z = 1:1:4. (d) Normalized local alignment distribution using all z stack data. The local alignment (e) and the high alignment ratio over the whole z stacks (f) were calculated. (g) LKB1 signaling pathway for LKB1WT, Empty GFP, and LKB1CTD case.

