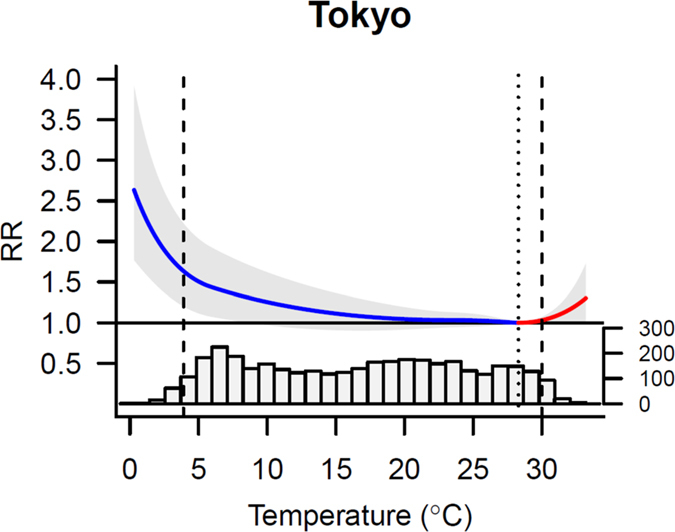
Figure 2. Overall cumulative exposure-response associations between the relative risks (95% CI) for OHCA and temperatures in Tokyo Prefecture.

Exposure-response associations expressed as the best linear unbiased prediction (with a 95% emperical confidence interval, shaded grey) with the related temperature distributions. Vertical lines represent the percentile of minimum morbidity temperature (dotted) and the 2.5th and 97.5th percentiles of the temperature distribution (dashed).
