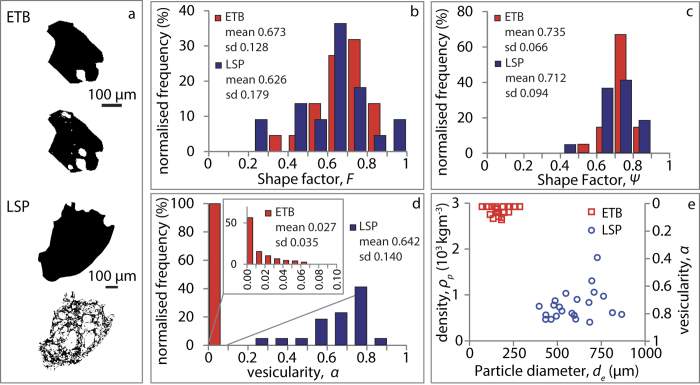
Figure 1. Size, shape, vesicularity and density distribution of the Etna Basalt (ETB), and Laacher See phonolite (LSP) ash samples obtained from SEM analysis.
(a) Examples of SEM images of ETB and LSP ash particles. The top images represent the particle outline; the bottom images show the area occupied by vesicles (in white). (b,c) Normalised frequency distribution of the shape factors F4 and Ψ10, used to compute the individual settling velocity of the particles using literature models. (d) Frequency distribution of 2-D vesicularity α, calculated as the fraction of the total projected area occupied by voids. Inset shows expanded vesicularity plot for ETB. (e) Diameter de vs. density ρp (and vesicularity α) diagram. The density of the analysed particle population is calculated from bulk density according to the vesicularity of each particle.

