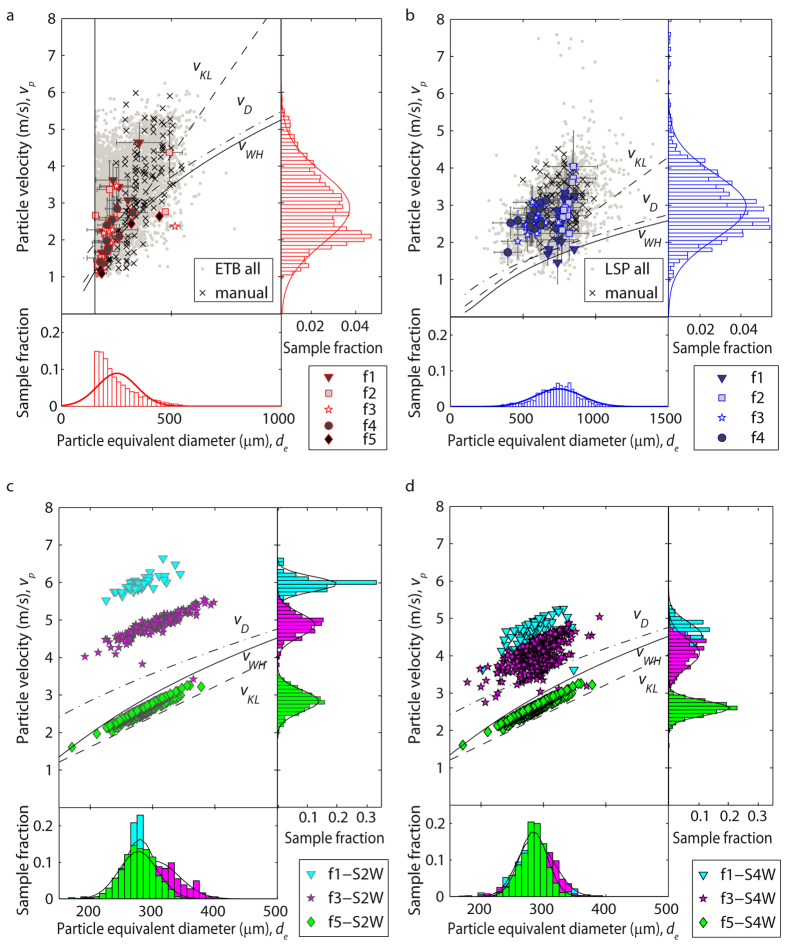
Figure 3.
Size (de) and settling velocity (vp) of (a) particles from Etna basalt (ETB) and (b) Laacher See phonolite (LSP) experiments, and (c) the two-way (S2W) and (d) four-way (S4W) numerical simulations. The theoretical variation of settling velocity with size is also plotted using the models of Wilson and Huang (vWH)4, Kunii and Levenspiel (vKL)5 and Dellino et al. (vD)10. The bottom and lateral panels in each sub-figure show the frequency distribution and normal fits of de and vp, respectively (note different scales). In (a) and (b), black crosses and grey dots represent manual and automatic tracking data respectively, while filled symbols denote the mean value with standard deviation (error bar) of data binned (every 5 s) for different mass discharge rate runs (f1, maximum, to f5, minimum). The vertical line in (a) indicates the image resolution limit. In (c) and (d), data points represent the mean value sampled every 0.2 s of simulation time for the different mass discharge rate runs (different symbols).

