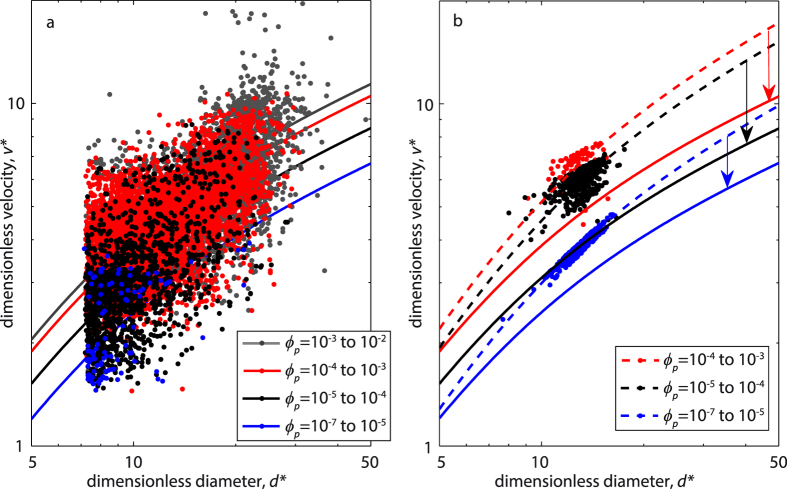
Figure 5.
Dimensionless particle size versus dimensionless settling velocity for the experimental (both ETB and LSP, a) and numerical (S4W) cases (b). Different colors denote particles settling within variable intervals of particle volume fraction (ϕp, note the larger interval for the lowest ϕp values, due to the occurrence of fewer particles in this range). Fitting curves (solid and dashed for the experimental and numerical cases, respectively) for the different ϕp intervals follow equation (3). Arrows in (b) mark the deviation between spherical (numerical) and irregular (experimental) particles.

