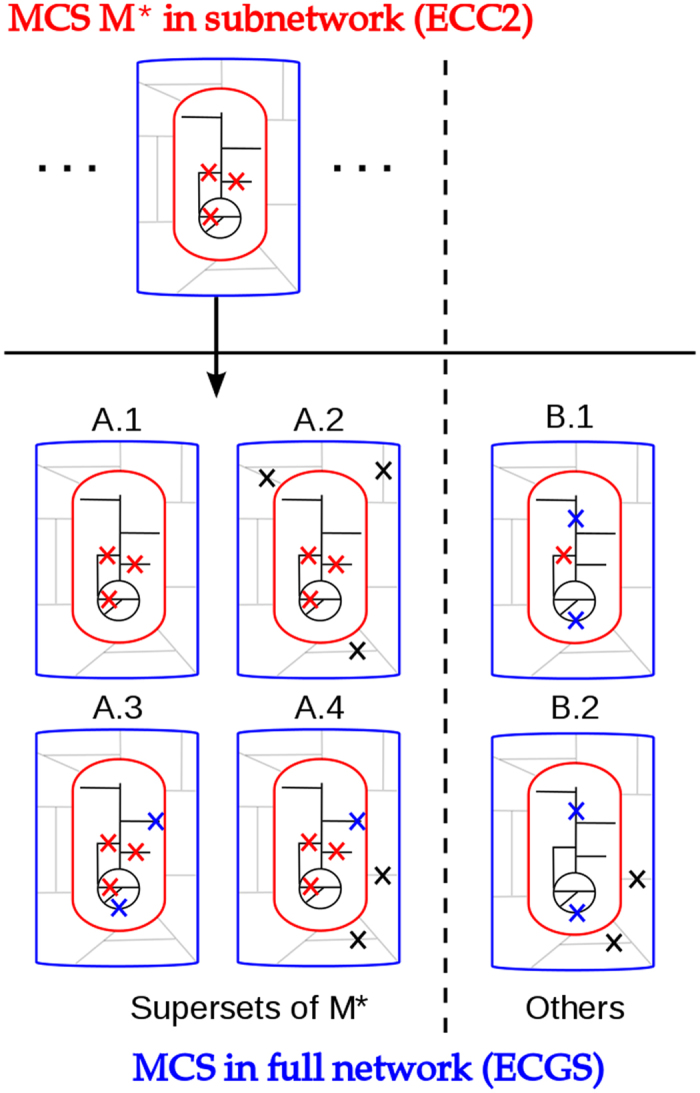
Figure 3. Categories of minimal cut sets (MCS) in ECGS with respect to a given (specific) MCS M* of ECC2.

The red oval comprises ECC2 and its corresponding reactions (black lines). The blue box indicates the ECGS model (including ECC2 and additional reactions). Grey lines: reactions of ECGS that are not in ECC2. Red crosses: reaction deletions contained in M*. Blue and black crosses indicate (additional) knockouts in an MCS of ECGS not contained in M*. Blue crosses: (additional) deletions of reactions in ECGS which are contained in the ECC2 part (but not contained as cuts in M*). Black crosses: (additional) deletions of reactions in ECGS outside the ECC2 part.
