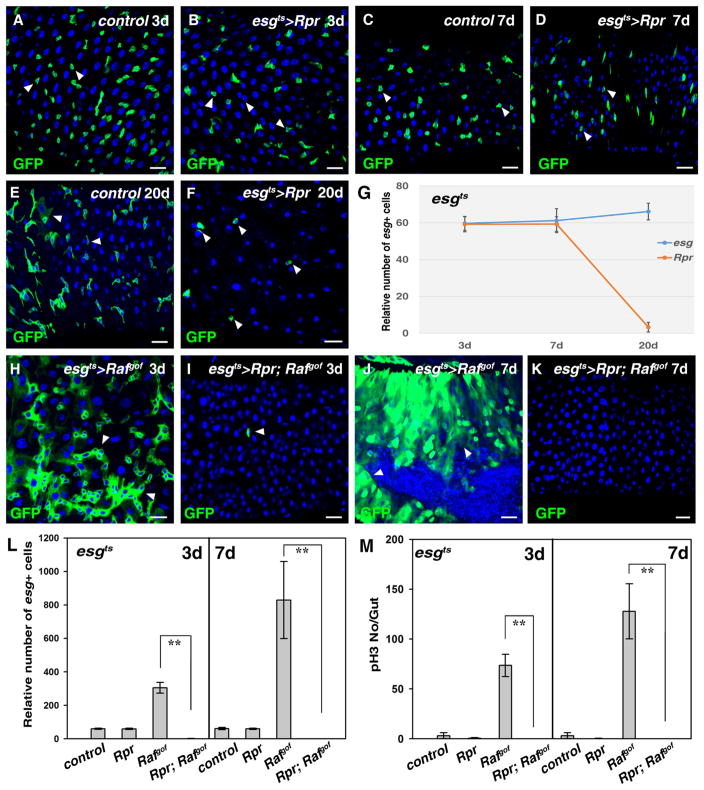
Fig. 1.
Tumor cells are more sensitive than wildtype progenitors to apoptosis in the adult Drosophila midgut. (A) Progenitors detected using esgGal4, UAS-GFP (green) in control midguts at 29 °C for 3 days (white arrowheads). (B) No obvious defects are observed in esgts>Rpr intestines at 29 °C for 3 days (white arrowheads). (C) Progenitors (green) in control midguts at 29 °C for 7 days (white arrowheads). (D) No obvious defects are observed in esgts>Rpr intestines at 29 °C for 7 days (white arrowheads). (E) Progenitors (green) in control midguts at 29 °C for 20 days (white arrowheads). Note that some large cells with GFP signal can be observed. (F) The number of esg+ cells is significantly reduced in esgts>Rpr intestines at 29 °C for 20 days (white arrowheads). Note that the morphology of the remaining esg+ cells is aberrant. (G) Quantification of the relative number of esg+ cells in the intestines of different genotypes at the indicated time points. n= 10–15 intestines. Mean ± SD is shown. **p<0.001. (H) Intestinal tumors in esgts>Rafgof intestines at 29 °C for 3 days (white arrowheads). (I) Tumor formation observed in esgts>Rafgof intestines is completely inhibited by co-expression of Rpr, and almost all esg+ cells are eliminated (white arrowhead). (J) Intestinal tumors in esgts>Rafgof intestines at 29 °C for 7 days (white arrowheads). Note that the intestines are deformed and tumor cells invade into the gut lumen. (K) All esg+ cells are eliminated in esgts>Rpr, Rafgof intestines at 29 °C for 7 days. (L) Quantification of relative number of esg+ cells in the intestines of different genotypes at 29 °C for 3 and 7 days, respectively. Note that because esgts>Rafgof intestines are highly deformed due to the formation of tumors, it is very difficult to accurately count the number of esg+ cells in these intestines. n=10–15 intestines. Mean ± SD is shown. **p<0.001. (M) Quantification of pH3 staining per gut in the intestines of different genotypes at 29 °C for 3 and 7 days, respectively. n=10–15 intestines. Mean ± SD is shown. **p<0.001. Blue indicates DAPI staining for DNA. Scale bars: 20 μm.

