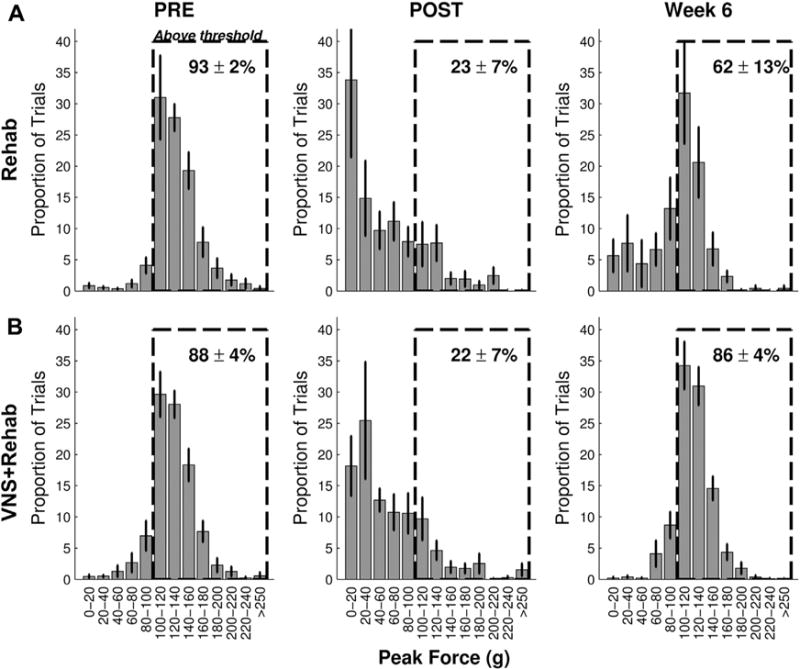
Fig. 3.

Distribution of pull forces. Probability distribution histograms of pull forces before lesion (PRE, left column), after lesion (POST, middle column), and on the sixth week of therapy (week 6, right column) for the Rehab (A) and VNS+Rehab groups (B). The numbers in the dashed box indicates the percent of trials that exceeded the 100-g hit threshold. Note the similarity of the distributions of pull forces at PRE and week 6 in the VNS+Rehab group consistent with a restoration of forelimb strength. Abbreviation: VNS, vagus nerve stimulation.
