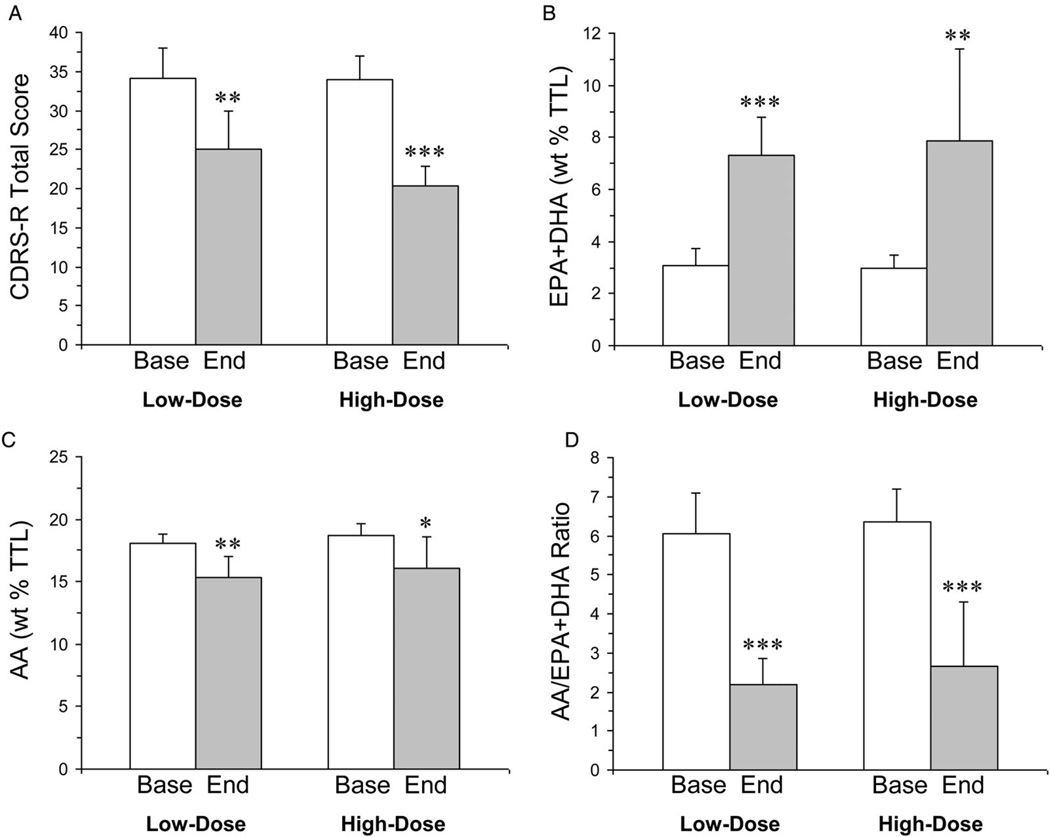
Figure 2.
CDRS-R total scores (A), erythrocyte EPA+DHA composition (weight percent total fatty acid composition, wt% TTL) (B), erythrocyte AA composition (C), and the AA/EPA+DHA ratio in MDD patients treated with low-dose or high-dose FO and had baseline (Base) and endpoint (End, week 10) 1H MRS values (n = 7/dose group). Values are group means±SD. *P ≤ 0.05, **P ≤ 0.01, ***P ≤ 0.0001 vs. baseline.

