
Figure 4.
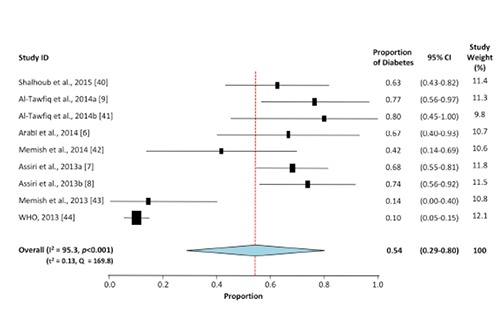
Meta-analysis for the proportion of diabetes in MERS-CoV cases. Weights are calculated from binary random-effects model analysis. Values represent proportion of diabetic cases in the MERS-CoV patients and 95% CI. Heterogeneity analysis was carried out using Q test, the among studies variation (I2 index) and in between-study variance in the random-effects model (τ2).