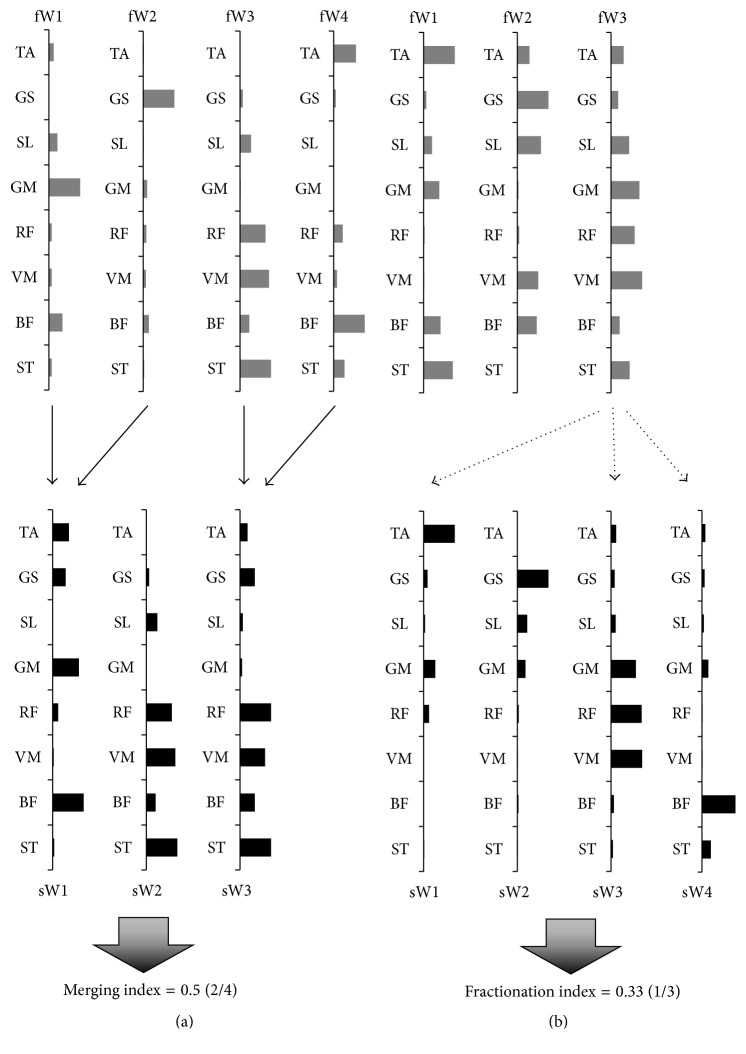
Figure 1.
Merging and fractionation of the synergies. The figures show the merging (solid line) and fractionation (dotted line) of the synergies at the first (gray) and second measurements (black). (a) Merging of synergies recorded from a patient; the weighting of the sW2 and sW3 synergy was reconstructed by linearly combining two pairs of synergies (fW1 and fW2, fW3 and fW4) from the first measurement. (b) Fractionation of the synergies that were recorded; the weighting of the fW3 synergy at the first measurement was reconstructed by linearly combining three synergies (sW1, sW3, and sW4) from the second measurement.

