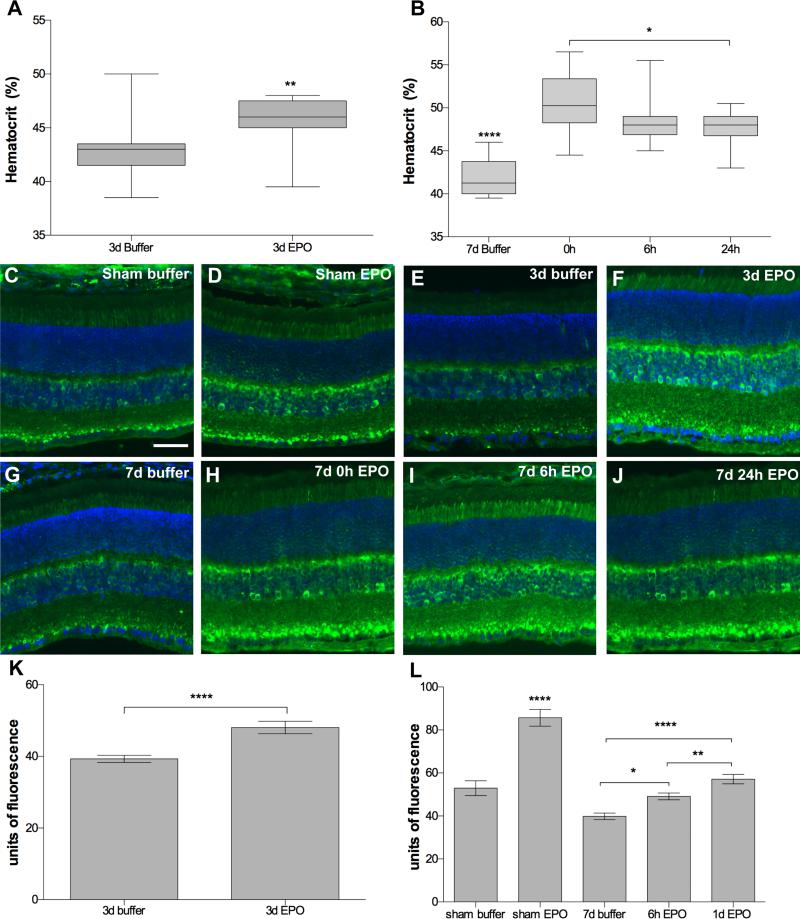
Figure 7.
Evidence for increased erythropoiesis and iron delivery in the EPO-treated DBA/2J mouse. (A, B) Box plots of hematocrit level at 3-days (A) or 7-days post-blast (B) showing an increase in all EPO treated mice. Note that the 7d post-blast buffer-injected mice had a lower hematocrit than all other groups, ****p<0.0001. *p<0.05, **p<0.01. Treatment with EPO also causes an increase in H-ferritin. (C-J) Representative fluorescence micrographs of retinas labeled with anti-H-ferritin. (C, D) Sham blast mice injected with: (C) buffer or (D) EPO. (E, F) 3 day post-blast mice injected with: (E) buffer, or (F) EPO. (G-J) 7 day post-blast mice injected with: (G) buffer, or (H-J) EPO beginning at (H) 0h, (I) 6h, or (J) 24h after blast. H-ferritin (green), DAPI (blue). Scale bar represents 50μm and applies to all images. (K, L) Bar graphs of the mean anti-ferritin immunofluorescence intensity in retinas from: (K) 3 days post-blast DBA/2J mice, ****p<0.0001, and (L) sham and 7 days post-blast DBA/2J mice, showing an increase in retinal ferritin in all EPO treated mice *p<0.05, **p<0.01, ****p<0.0001.

