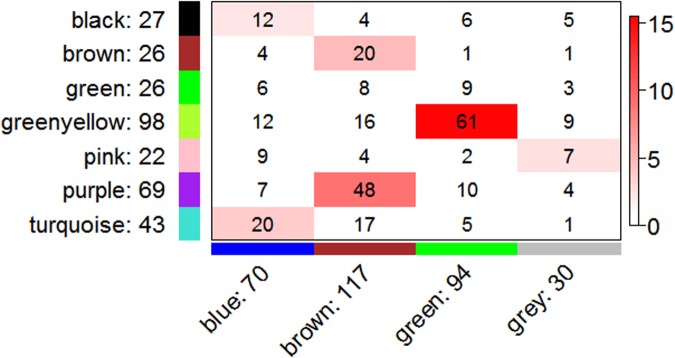
FIGURE 4.
Correspondence of co-expression in R8B6 and R2D2 consensus network modules. Rows represent one R2D2 module (labeled by color and text), and columns represent one R8B6 module. Numbers in each cell indicate gene counts in the intersection of the corresponding modules. Coloring of the table encodes - log(p), with significance as Fisher’s exact test p-value for overlap of the two modules. Greater significance is indicated by a more intense red color.

