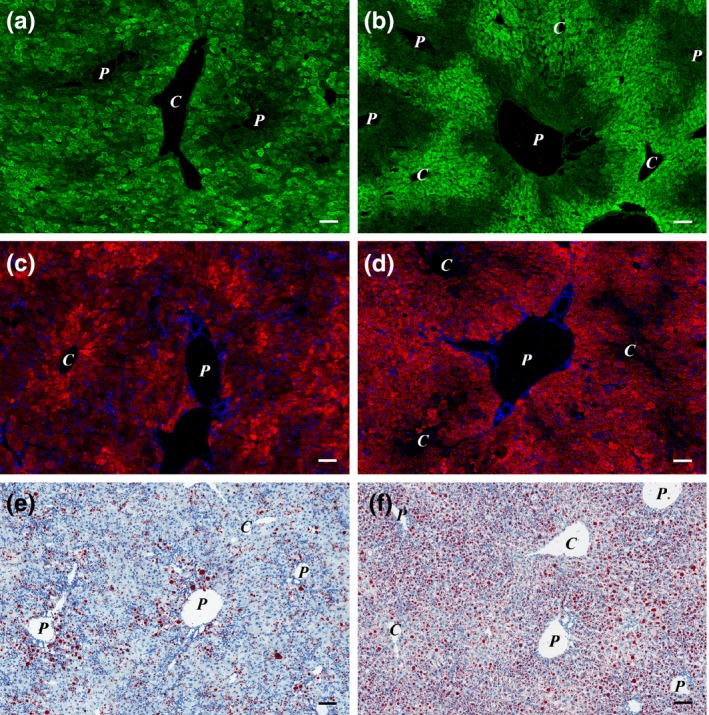
Figure 5.

(a–d) Imatinib treatment preserves zonality of the liver in CDE‐fed mice. (a and b) CYP2E1 (green); (c and d) Streptavidin‐TRITC (red) and DAPI (blue) labelled; (e and f) oil red O stained frozen sections of Group 1 (CDE; a, c and e) and Group 2 (CDE+imatinib; b, d and f) animals. The pericentral expression of CYP2E1 (green) and the periportal distribution of endogenous biotin (red) can be observed in the imatinib‐treated animals (b and d), while the normal distribution of these two markers is lost in the mice fed with CDE only (a and c). The degree of steatosis increased in the imatinib‐treated group (f; Group 2). P stands for portal vein, and C stands for central vein. Scale bar for Figure 5: 100 μm.
