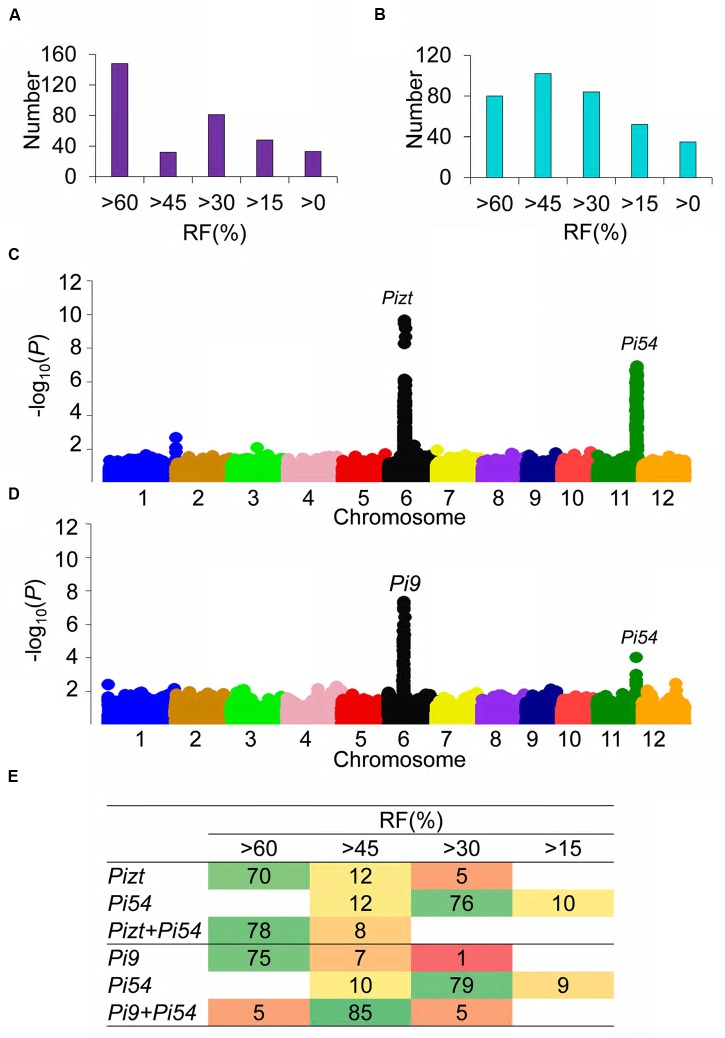
FIGURE 4.
Extreme-phenotype genome -wide association study of QTL loci related to panicle blast resistance. (A) Panicle blast resistance classification in the F2 segregating population of PPLPizt+Pi54/07GY31; (B) Panicle blast resistance classification in the F2 segregating population of PPLPi9+Pi54/07GY31; (C) XP-GWAS of panicle-blast-resistance-related loci in the F2 segregating population of PPLPizt+Pi54/07GY31; (D) XP-GWAS of panicle-blast-resistance-related loci in the F2 segregating population of PPLPi9+Pi54/07GY31. (E) Distributions of Pi9, Pizt, and Pi54 in the F2 segregating population of PPLPizt+Pi54/07GY31 and the F2 segregating population of PPLPi9+Pi54/07GY31. Numbers in the table of Figure 4E is the number of plants with Pi9, Pizt, Pi54, Pizt+Pi54, Pi9+Pi54.

