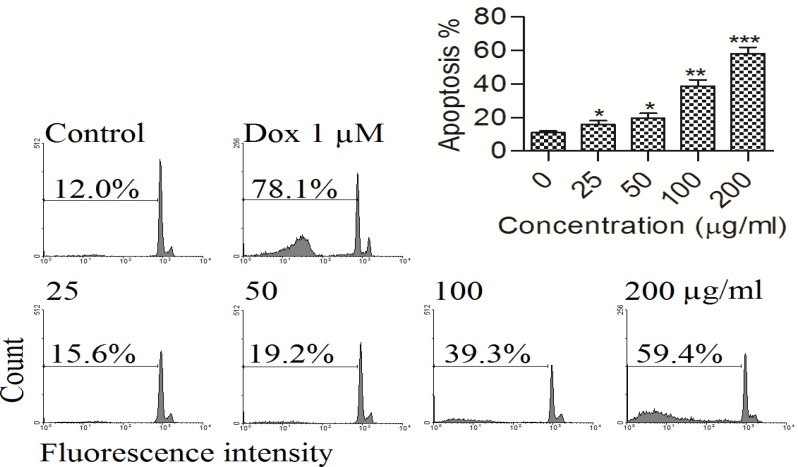
Figure 2.
A) Flow cytometry histograms of apoptosis assays by PI method in PC3 cells. Cells were treated with different concentration of hydro-ethanol extract of B. multifida (0, 25, 50, 100 and 200 µg/ml) for 48 hr. Sub-G1 peak as an indicative of apoptotic cells, was induced in hydro-ethanol extract of B. multifida-treated but not in control cells. Treated cells exhibited a sub-G1 peak in PC3 cells in a concentration-dependent manner that indicates the involvement of an apoptotic process in hydro-ethanol extract of B. multifida -induced cell death. Results are representative of three independent experiments. ∗p <0.05, ∗∗p <0.01 and ∗∗∗p <0.001 compared to control

