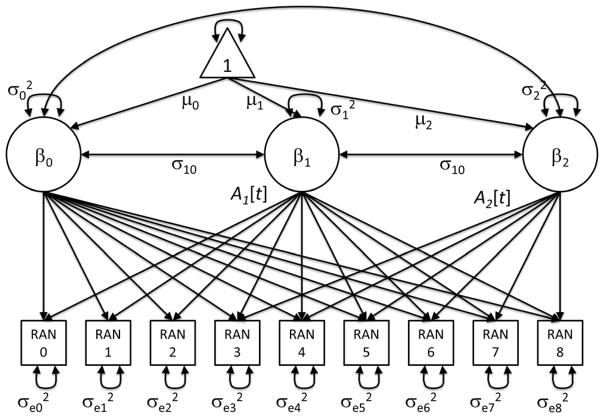
Figure 2.
A path diagram of the multiphase latent basis growth model. The three latent variables represent the intercept, the rate of increases, and the rate of decreases (random coefficients of Equation 2). In this path diagram, the increases occur between time 0 and 2 and the decreases occur between time 2 and 8. The timing of the transition varied over outcomes and was determined based upon sample statistics. The latent variables have means, variances, and covariances.

