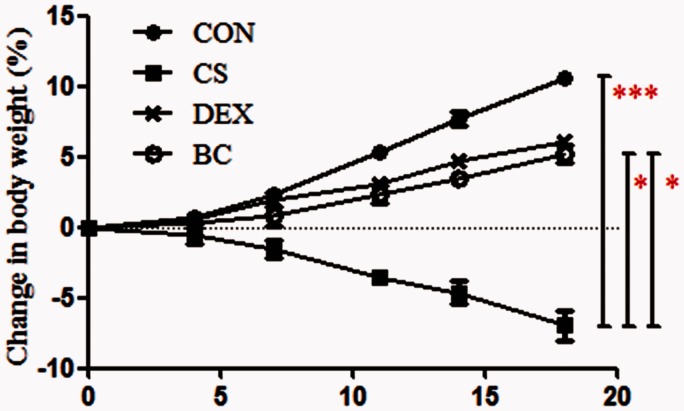
Figure 3.
Effect of BC on variation in body weight. Body weights were determined for each group of mice twice a week. Statistical analysis was performed on day 19 after CS exposure. Values are mean ± SEM. Statistical analysis was by one-way ANOVA; *P < 0.05 and ***P < 0.001. (A color version of this figure is available in the online journal.)

