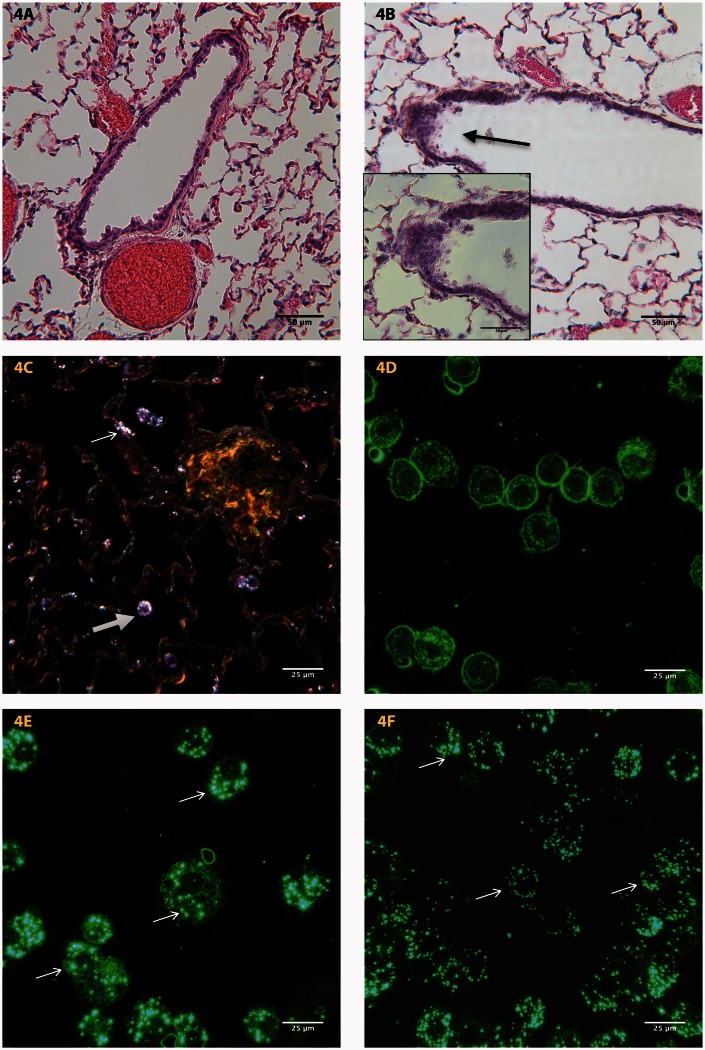
Figure 4.
Representative photomicrographs of formalin fixed tissue section from the lungs of (a) control and (b) animals treated with a concentration 10 mg/m3 of WO3 NPs. H&E stained sections of treated animals showed areas of hyperplasia (arrow). The inset shows a higher magnification of the arrowed region. (c) Sections from lungs of treated animals examined by dark field microscopy reveal the presence of WO3 NPs within the epithelium (arrow) and in macrophages (open arrows). (d) Dark field micrographs of BALF cyto-smears from control animals prepared as described in methods section, lacked the birefringence particles that were seen (arrow) in macrophages from animals treated with 5 mg/m3 (e) and 10 mg/m3 (f) of WO3 NPs. (A color version of this figure is available in the online journal.)

