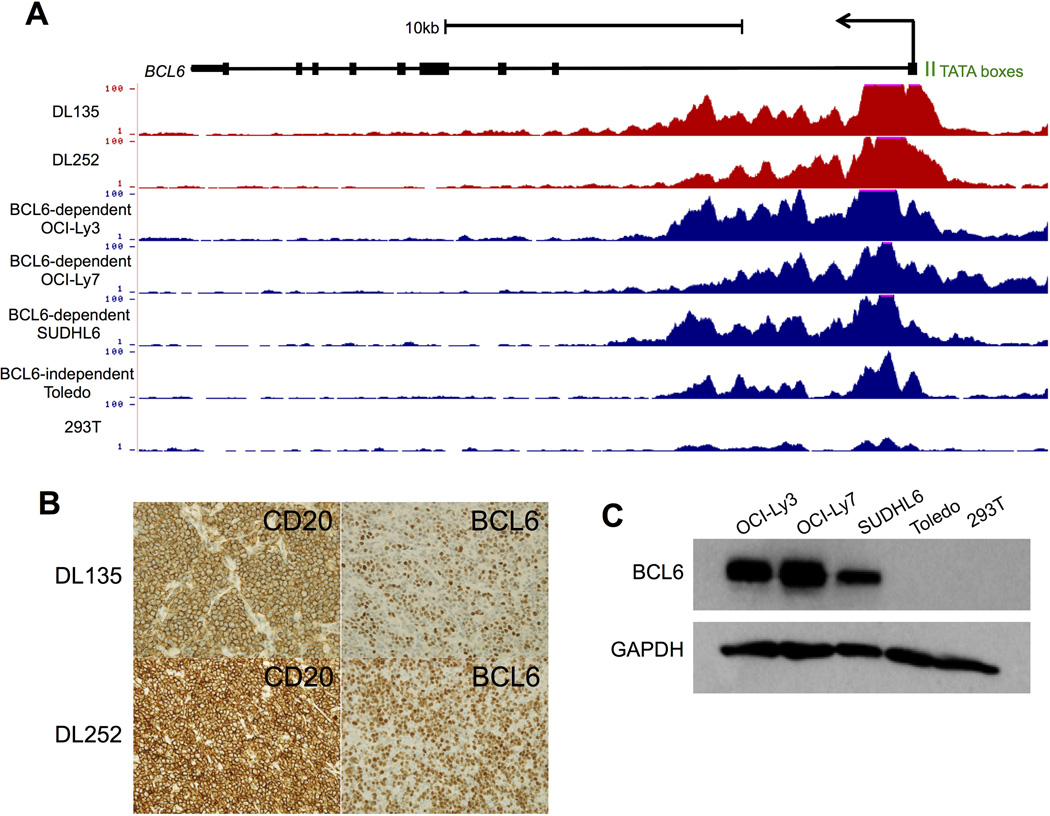
Figure 1. High levels of H3 acetylation at the BCL6 gene locus are associated with high levels of protein expression.
A) UCSC Genome Browser views of H3ac ChIP-seq data from DLBCL primary samples, DLBCL cell lines, and HEK293T cells illustrating the levels of acetylation located at the promoter and first exon/intron of the BCL6 locus. Data are presented as the number of reads per million mapped reads. B) Representative images for DL cases 135 and 252 (shown in A) with membranous CD20 staining (left, x400) and nuclear BCL6 staining (right, x400). C) Western blots for BCL6 or GAPDH (loading control) in cell lysates from cell lines (shown in A).

