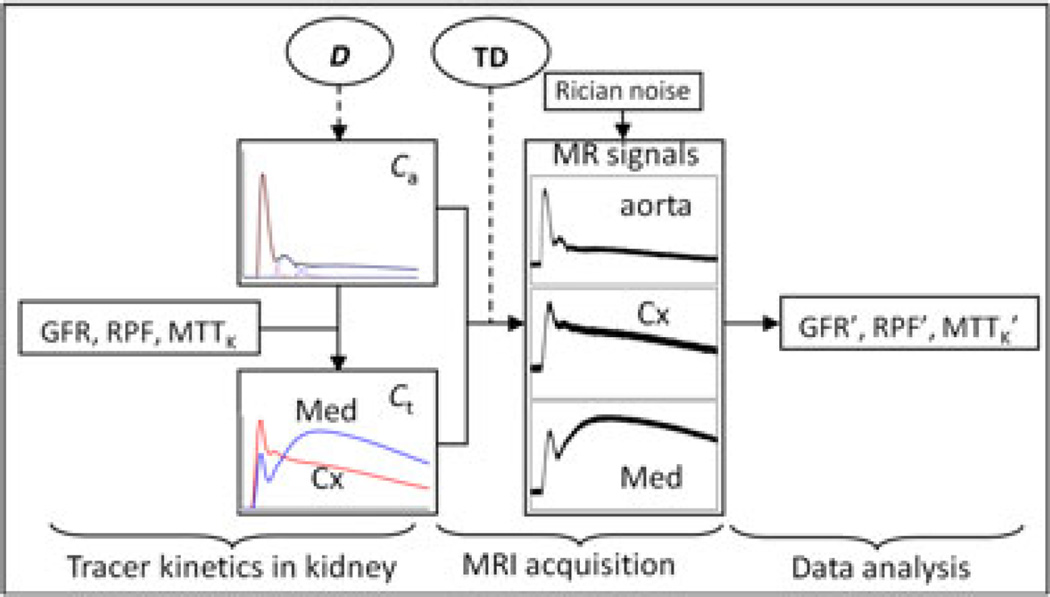
Figure 1.
Diagram of the simulation procedure. The forward simulation includes the simulation of tracer kinetics in the kidney and MR renography acquisition to obtain MR signals. Rician noise was added to the signals, followed by MR renography analysis to estimate the functional parameters (GFR, glomerular filtration rate; MTTK, mean transit time of kidney; RPF, renal plasma flow). Gadolinium dose (D) determines the magnitude of the arterial input function (Ca), and the scaling effect is further propagated into Gd concentration in kidney tissue (Ct). The time delay (TD) is adjustable to change the MR signal intensity. Cx denotes cortex, and Med denotes medulla.

