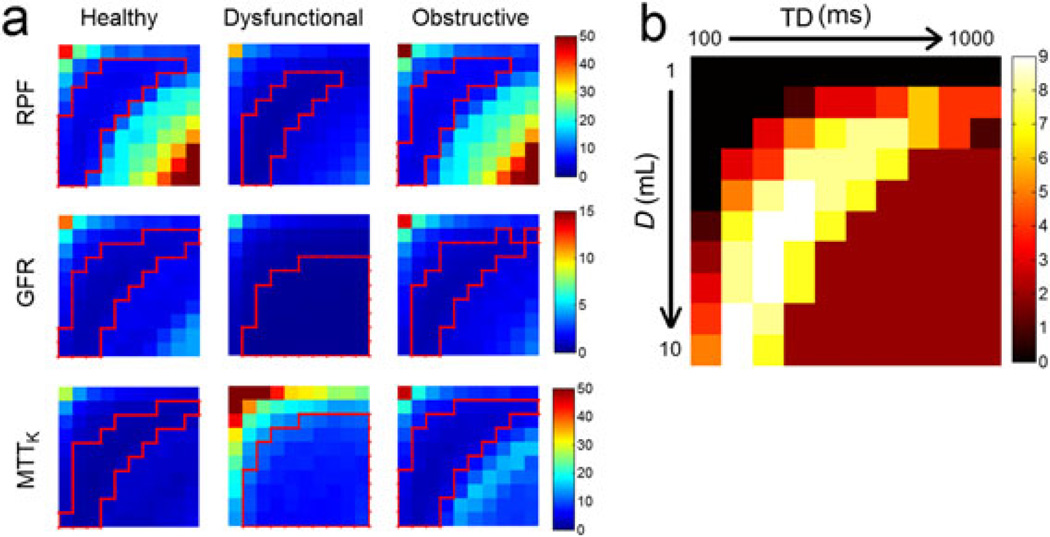
Figure 2.
(a) Standard deviation (SD) for the estimates of renal plasma flow (RPF, mL/min), glomerular filtration rate (GFR, mL/min) and mean transit time of kidney (MTTK, s) for healthy, dysfunctional and obstructive kidneys. Low SD regions are outlined by red lines. (b) The score map that combines low SD regions in all nine maps. In each map, columns increase from time delay (TD) = 100 ms to TD = 1000 ms and rows increase from dose (D) = 1 mL to D = 10 mL.

