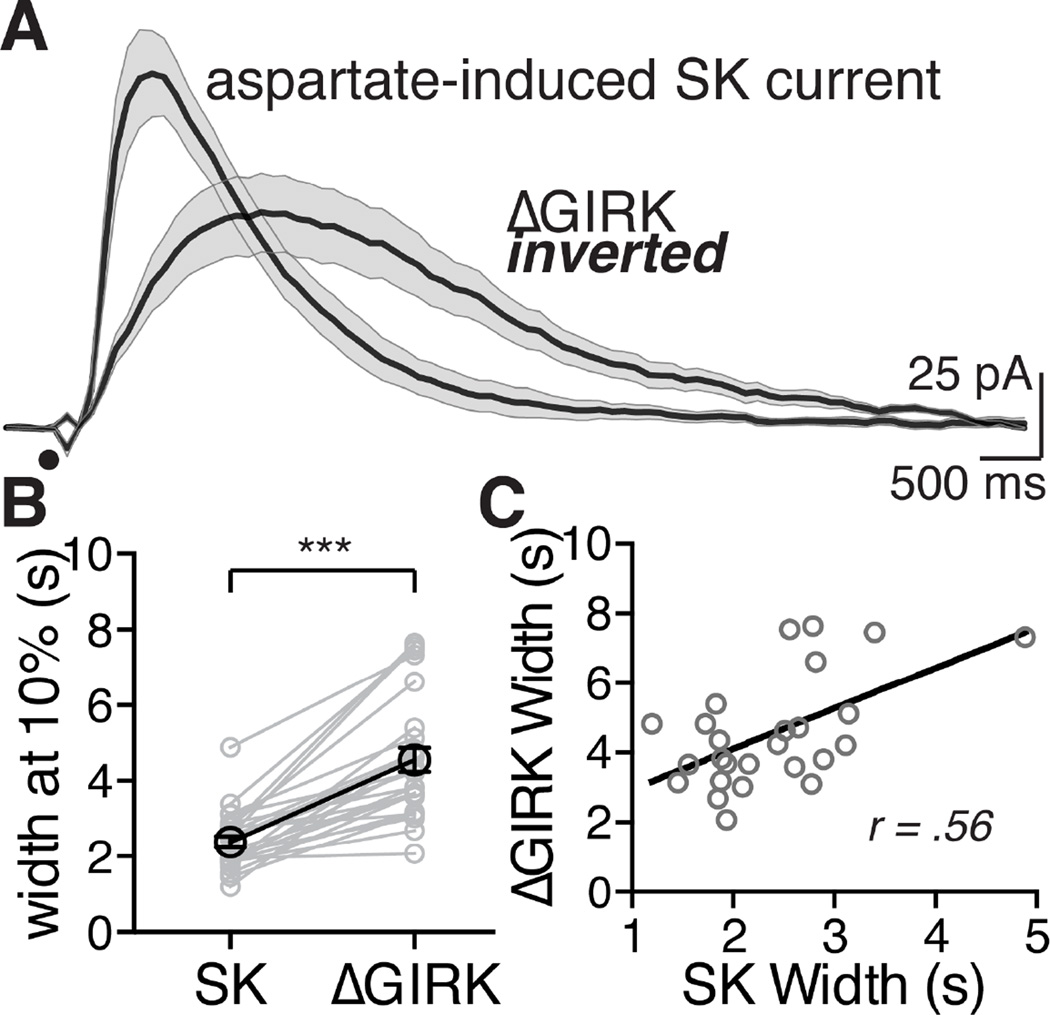
Figure 3. The mGluR-mediated SK current and ΔGIRK inward current have different kinetics and are correlated.
A. Averaged traces of currents (SK and ΔGIRK) following iontophoresis of aspartate (black circle). Each trace is an average of 12 cells, the shaded area around the mean value represents s.e.m. ΔGIRK current is inverted to compare the timescale to SK.
B. Within-cell comparison of the width at 10% of the peak for the SK current and the corresponding ΔGIRK current for that cell. ΔGIRK was significantly longer at 10% of the peak than SK. ***p < 0.001, statistics were performed with a two-tail paired t-test.
C. Comparing within-cell the width of the SK versus the width (both at 10%) of the ΔGIRK reveals a significant positive correlation, analyzed with a Pearson correlation test, p < 0.01, r = 0.56, n = 26 cells for B and C.

