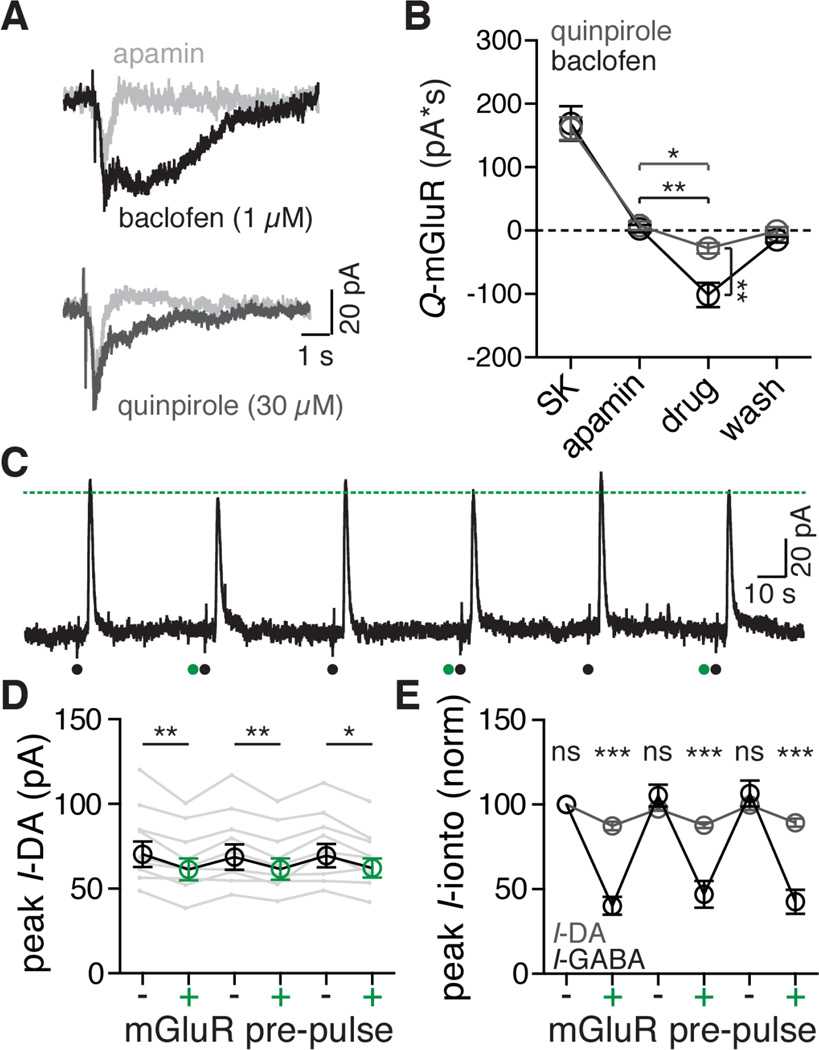
Figure 7. mGluR-induced calcium release inhibits D2R mediated GIRK currents less than GABAB.
A. Representative traces of currents induced by iontophoresis of aspartate in the presence of apamin (300 nM, light gray), baclofen (1 µM, top trace, black), and quinpirole (30 µM, bottom trace, black).
B. Quantified data across cells comparing the aspartate induced mGluR currents at baseline (SK), after apamin (300 nM), in either quinpirole (30 µM, grey) or baclofen (1 µM, black), and upon washout or reversal of the agonist. Both quinpirole and baclofen resulted in a decrease in GIRK current relative to apamin. Statistics were performed with two one-way ANOVAs followed by a Bonferroni test. *p < 0.05, **p < 0.01, n = 8 (quinpirole), n = 7 (baclofen), points represent means ± s.e.m.
C. Representative trace from a dual iontophoresis protocol with dopamine (black dot) and aspartate (green dot) in the presence of apamin (300 nM). Dotted green line indicates the peak of the GIRK current induced by iontophoretic application of dopamine following application of aspartate. Aspartate iontophoresis caused a consistent decrease the D2R–mediated current.
D. Grouped data showing the peak amplitude of the dopamine D2 receptor-mediated GIRK current with (green) and without (black) iontophoretic application of aspartate one second before dopamine iontophoresis in the presence of apamin (300 nM). Statistics were performed with a one-way repeated measures ANOVA followed by a Bonferroni test, *p < 0.05, **p < 0.01, n = 9 cells. Grey traces indicate within-cell data for single neurons, circles (black and green) ± s.e.m.
E. Grouped data for all dopamine (grey) and GABA (black) dual iontophoresis experiments, normalized to the peak amplitude of the first pulse. Data points indicate means ± s.e.m. Statistics were performed with a two-way repeated measures ANOVA followed by a Bonferroni test, ***p < 0.001, ns = not significant (p > 0.99), n = 9 cells for both groups.
See also Figure S7

