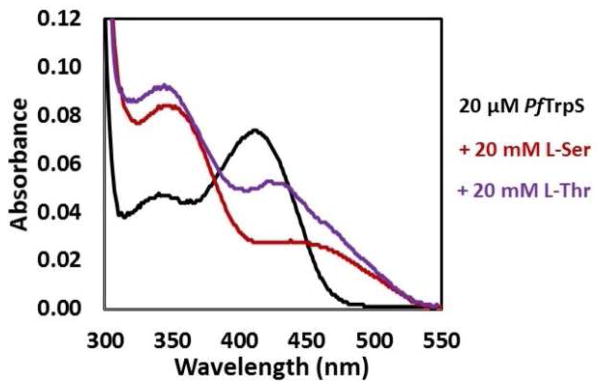
Figure 2.
UV-vis absorbance spectra of PfTrpS. In the absence of substrate PfTrpS (20 μM) has an absorbance spectrum corresponding to E(Ain).3 Addition of 20 mM L-Ser yields a spectrum with λmax = 350 nm. A similar peak with λmax = 345 nm accumulates when L-Thr is added. This shift may reflect a mix of signals with α-ketobutyrate (λmax = 319 nm) formed from the fast deamination of L-Thr. The additional peak at ~425 nm corresponds to a small population of the E(Aex1) intermediate.

