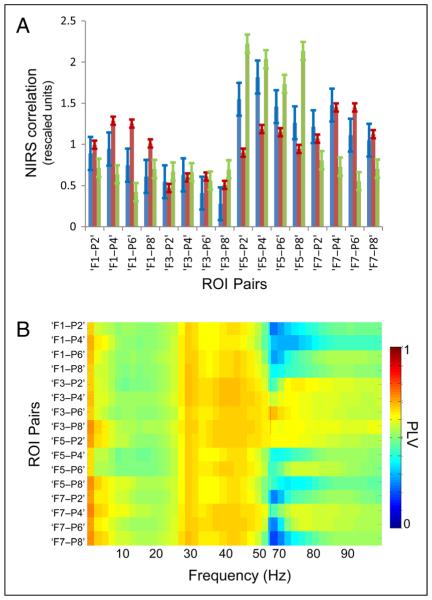
Figure 3.
Interregional resting state signal interactions. (A) Histograms of average pairwise NIRS correlation values at rest are plotted for three subjects. Values for each interregional ROI pair are plotted along the abscissa. Error bars represent the standard error. (B) Grand-averaged interregional SFP PLVs across all subjects. Values between 55 and 65 Hz were contaminated by powerline artifact and are excluded for clarity. Color bar denotes absolute PLV.

