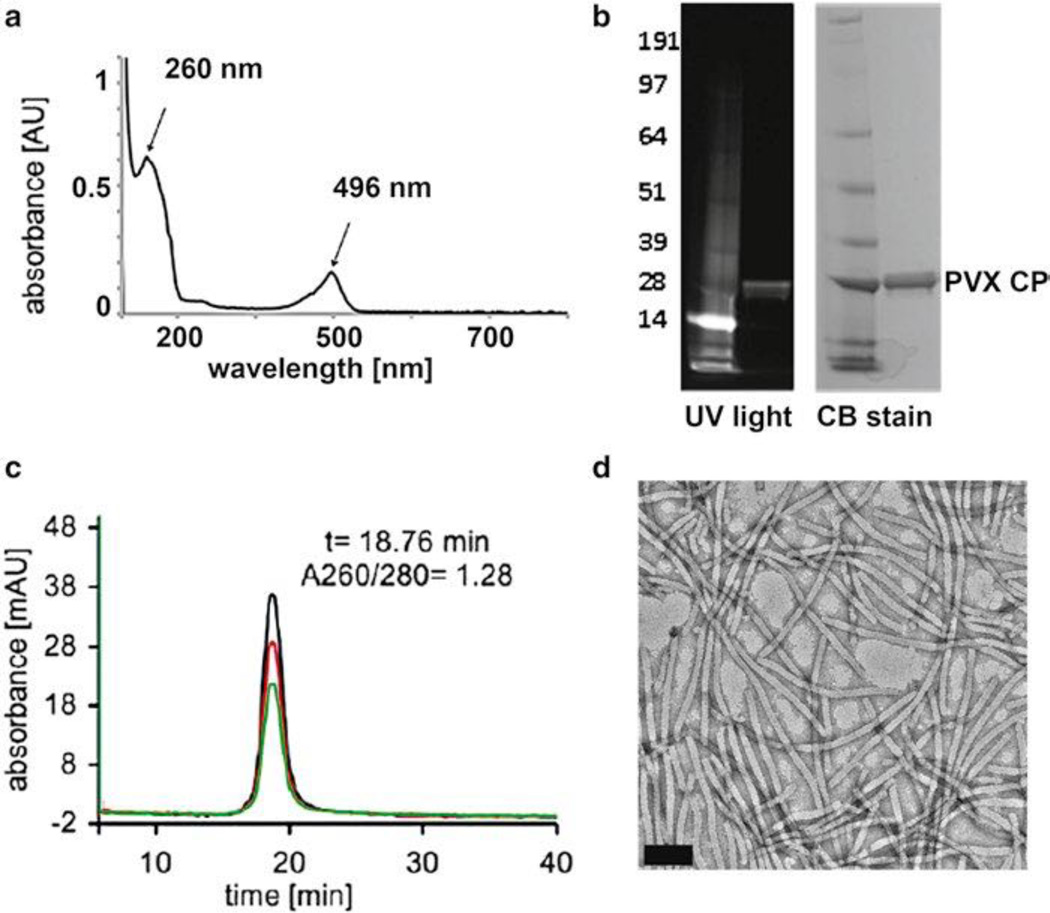
Fig. 4.
Characterization of PVX-O488 (a) UV–Visible spectrum indicating the PVX and O488 characteristic peaks at 260 nm (PVX nucleic acids) and 496 (O488), (b) SDS-PAGE gel before and after Coomassie blue stain; the fluorescence of the coat protein indicates covalent labeling with the O488 dye, (c) FPLC spectra, black line = 260 nm, red line = 280 nm, green line = 496 nm; nucleic acid, protein, and dye co-elute indicating successful labeling and intact PVX (reproduced from Steinmetz et al. 2010, Nano Letters), and (d) TEM of negatively stained PVXO488, scale bar is 100 nm

