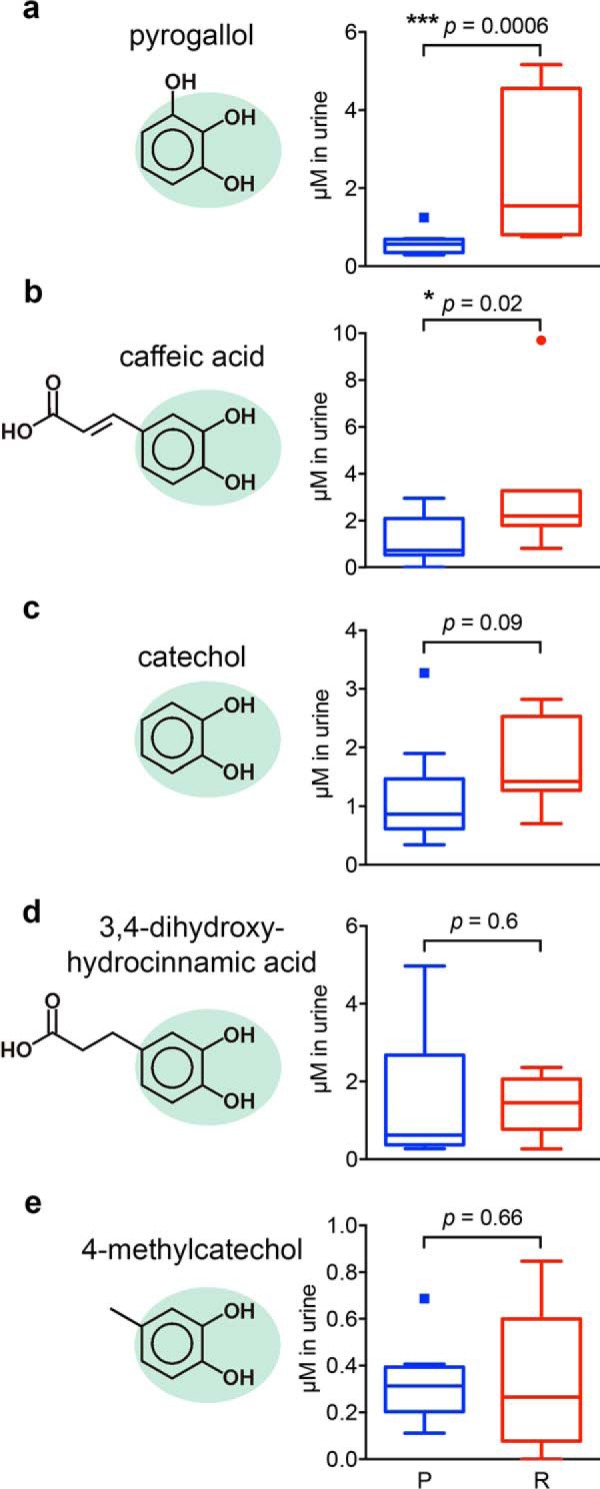
FIGURE 5.

Restrictive urines have improved correlation with urinary ligand concentrations. We compared SCN ligand concentrations by GC-MS in restrictive (R; red boxes; n = 8) versus permissive urines (P; blue boxes; n = 9). Here, molar concentrations were measured in whole urine following urease treatment. Urines were spiked with the exometabolite 4FSA, and peak area ratios were compared with standard curves prepared with pure standard of each metabolite and 4FSA. Data are shown as Tukey box-and-whisker plots. Pyrogallol and caffeic acid were found to be significantly (p = 0.0006 and p = 0.02, respectively) elevated in restrictive samples (a and b). Catechol trended toward significance (p = 0.09) (c), whereas 3,4-dihydroxyhydrocinnamic acid (d) and 4-methylcatechol (e) were not consistently associated with restrictive or permissive urines in these samples. *, p < 0.05; ***, p < 0.001; Mann-Whitney U test.
