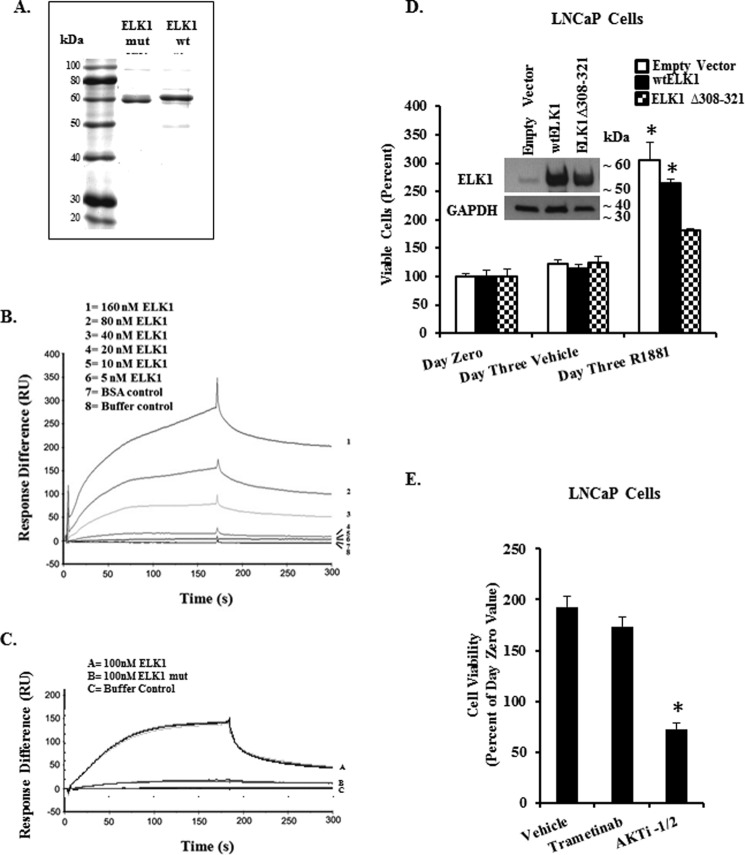
FIGURE 8.
Direct binding of ELK1 and AR and the effect of disrupting docking sites in ELK1 on AR binding and androgen-dependent cell growth. A shows SDS-PAGE of purified His-tagged ELK1 protein and His-tagged ELK1 protein mutated (ELK1 mut) in both D-box (Δ308–321) and DEF motif. The protein bands were visualized by Coomassie Blue staining and estimated to be >85% pure and used in the SPR experiments below together with purified AR obtained commercially. B shows SPR kinetic curves for quantitative analyses of AR binding to His-tagged ELK1. AR was immobilized on a CM5 sensor chip, and ELK1 was diluted in a series of concentrations (0, 5, 10, 20, 40, 80, and 160 nm). The results were normalized by subtracting the SPR response (RU) for buffer alone or BSA and performed in duplicate. C shows SPR kinetic curves for quantitative analyses of AR binding to His-tagged mutant ELK1. AR was immobilized as in B, and ELK1 or mutant ELK1 was used at 100 nm. The kinetic curves for triplicate determinations are shown. D, hormone-depleted LNCaP cells were transduced using lentivirus expressing either the WTELK1, or ELK1(Δ308–321), or with control lentivirus. After 72 h, cells were plated in 96-well plates, and cell growth was monitored by the MTT assay. Twenty four hours after plating, the cells were treated with R1881 (1 nm) or vehicle for a further 72 h. The inset in D shows Western blotting analysis of cell lysates, 72 h post-infection, using antibody to ELK1 or with antibody to GAPDH (loading control). The error bars represent standard deviation of experimental triplicates. *, p < 0.001. E, hormone-depleted LNCaP cells were plated in 96-well plates in the presence of R1881 (1 nm) together with vehicle, trametinib (1 μm), or AKTi-1/2 (2 μm). MTT assay was performed 72 h later. The error bars represent standard deviation of experimental triplicates. *, p < 0.001.

