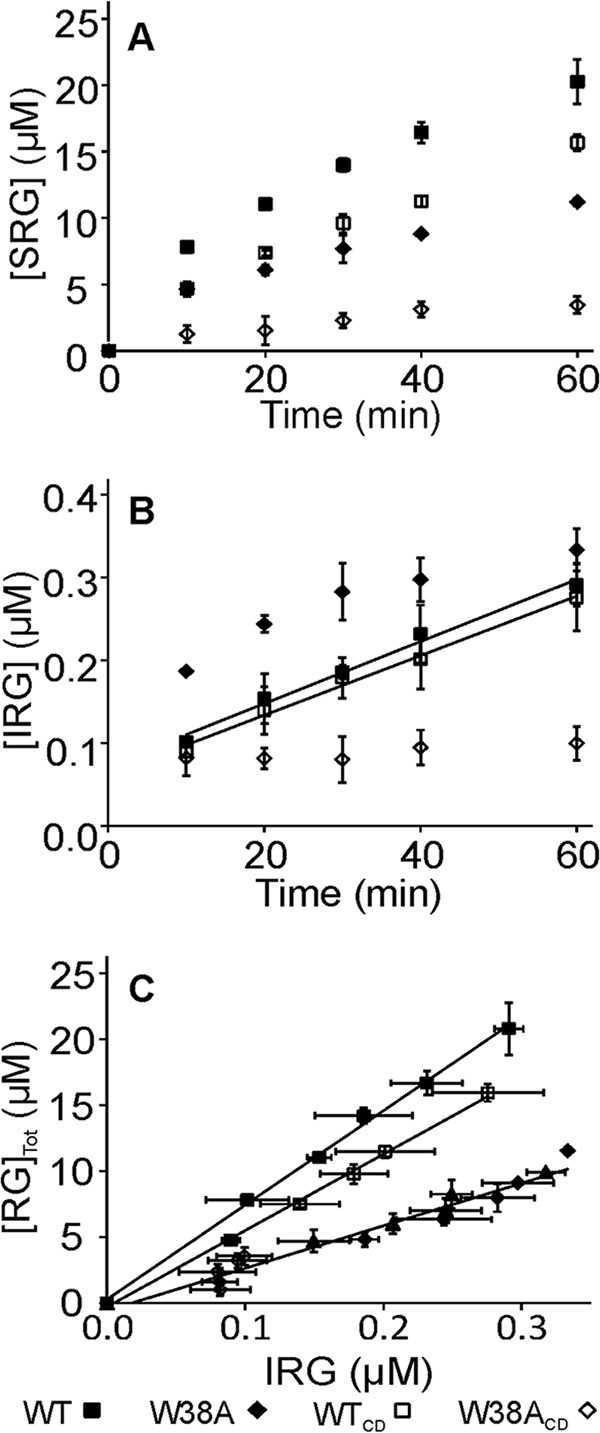
FIGURE 3.

Formation of soluble and insoluble reducing groups in hydrolysis of rBC. rBC (1 mg ml−1) was incubated with 100 nm TrCel7A and the formation of SRGs (A) and IRGs (B) in time was followed. Solid lines in B for the series with WT and WTCD are from linear regression and the slopes were used to calculate the values of kIRG. In panel C, the data are plotted in coordinates [RG]tot versus [IRG]. Solid lines are from linear regression and the slope equals the Papp value. Error bars show S.D. and are from three independent experiments. With W38A, experiments were also made using 62 nm enzyme concentrations (▴).
