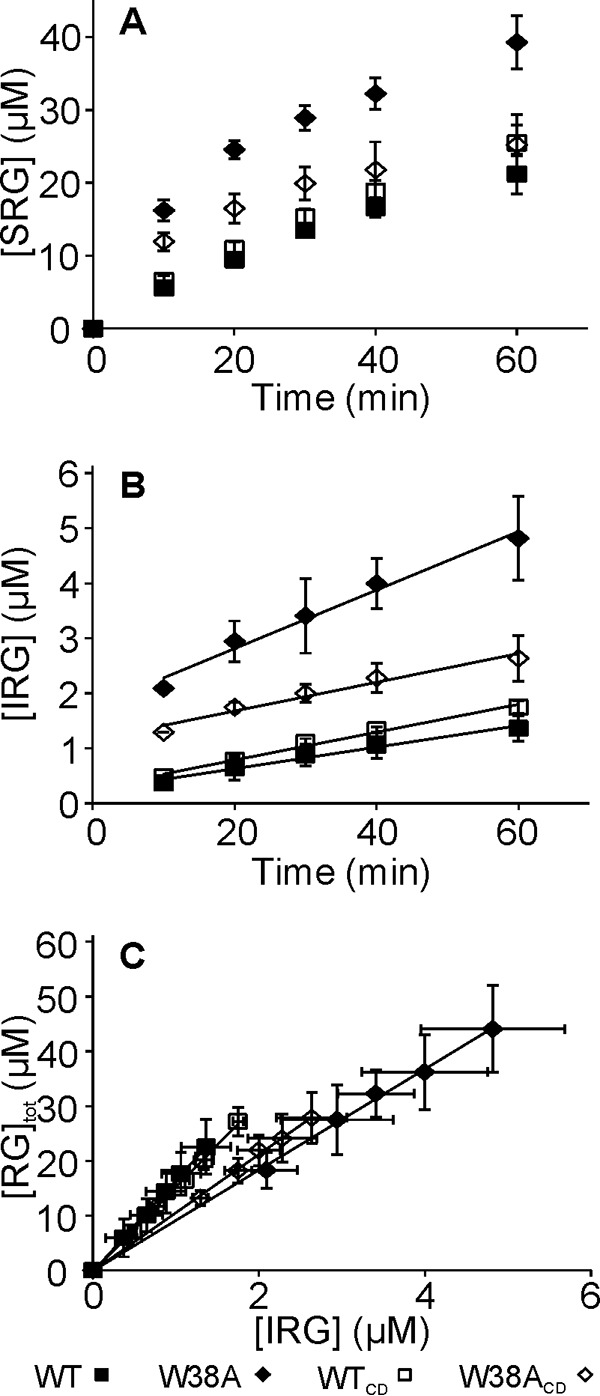
FIGURE 4.

Formation of soluble and insoluble reducing groups in hydrolysis of rAC. rAC (1 mg ml−1) was incubated with 100 nm TrCel7A and the formation of SRGs (A) and IRGs (B) in time was followed. Solid lines in B are from liner regression and the slopes were used to calculate the values of kIRG. In panel C, the data are plotted in coordinates [RG]tot versus [IRG]. Solid lines are from linear regression and the slope equals the Papp value. Error bars show S.D. and are from three independent experiments.
