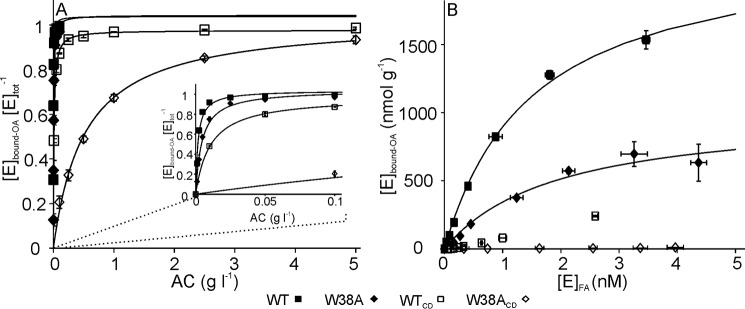
FIGURE 6.
The active site mediated binding of TrCel7A and its variants to AC. A, binding was measured with 5 nm total concentration of TrCel7A ([E]tot) by varying the concentration of AC between 0.001 and 5 g liter−1. Inset shows the enlargement of the region of low AC concentrations. Solid lines represent the best fit of non-linear regression according to Equation 2. B, binding data from panel A re-plotted in coordinates of concentration of the active site bound enzyme versus the concentration of enzyme with free active site. Solid lines represent the best fit of non-linear regression according to one binding site Langmuir isotherm. Error bars show S.D. and are from three independent experiments.

