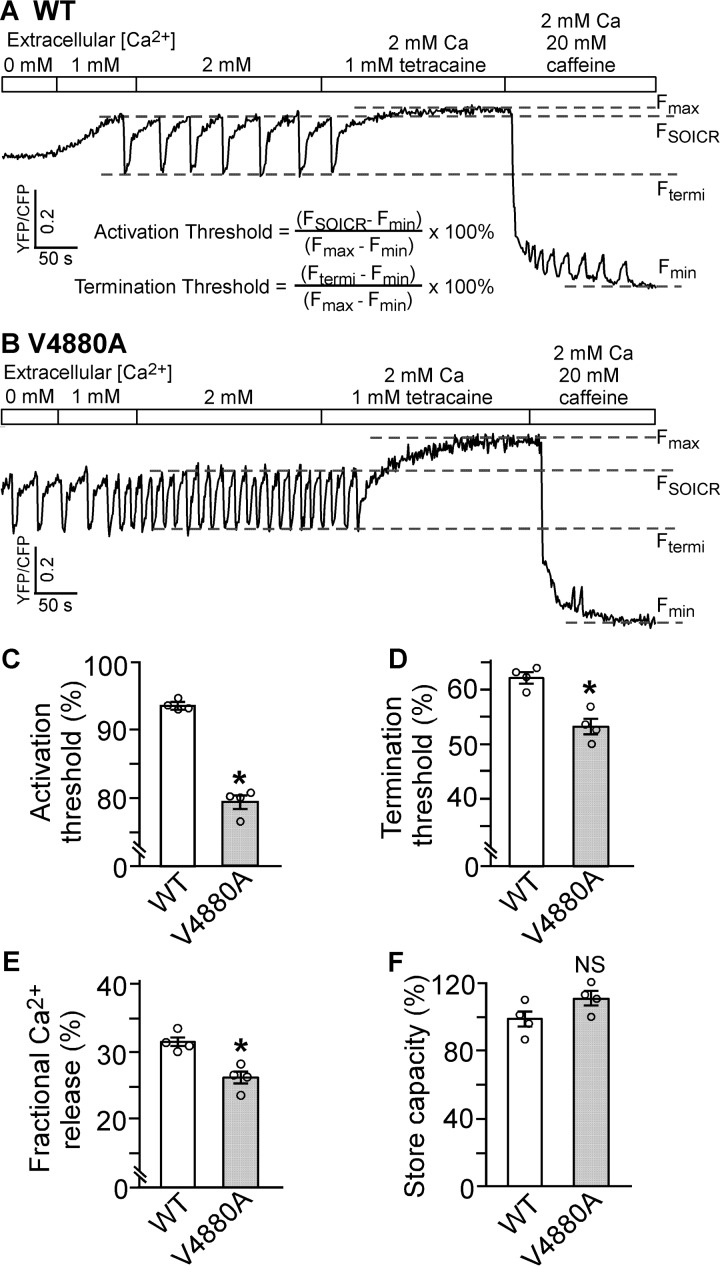
FIGURE 9.
Effect of V4880A on SOICR activation and termination thresholds. A and B, stable, inducible HEK293 cell lines expressing RyR2 WT (A) and V4880A (B) were transfected with the FRET-based ER luminal Ca2+-sensing protein D1ER 48 h before single-cell FRET imaging. Expression of the RyR2 WT and mutant was induced 24 h before imaging. The cells were perfused with KRH buffer containing increasing levels of extracellular Ca2+ (0–2 mm) to induce SOICR. This was followed by the addition of 1.0 mm tetracaine to inhibit SOICR and then 20 mm caffeine to deplete the ER Ca2+ stores. FRET recordings from representative RyR2 WT (total 57 cells, A) and mutant V4880A cells (total 53 cells, B) are shown. C and D, to minimize the influence of CFP/YFP cross-talk, we used relative FRET measurements to calculate the activation threshold (C) and termination threshold (D) using the equations shown in A. FSOICR indicates the FRET level at which SOICR occurs, whereas Ftermi represents the FRET level at which SOICR terminates. E, the fractional Ca2+ release was calculated by subtracting the termination threshold from the activation threshold. The maximum FRET signal Fmax is defined as the FRET level after tetracaine treatment. The minimum FRET signal Fmin is defined as the FRET level after caffeine treatment. F, the store capacity was calculated by subtracting Fmin from Fmax. Data shown are mean ± S.E. (n = 4; *, p < 0.05 versus WT; NS, not significant).

