FIGURE 4.

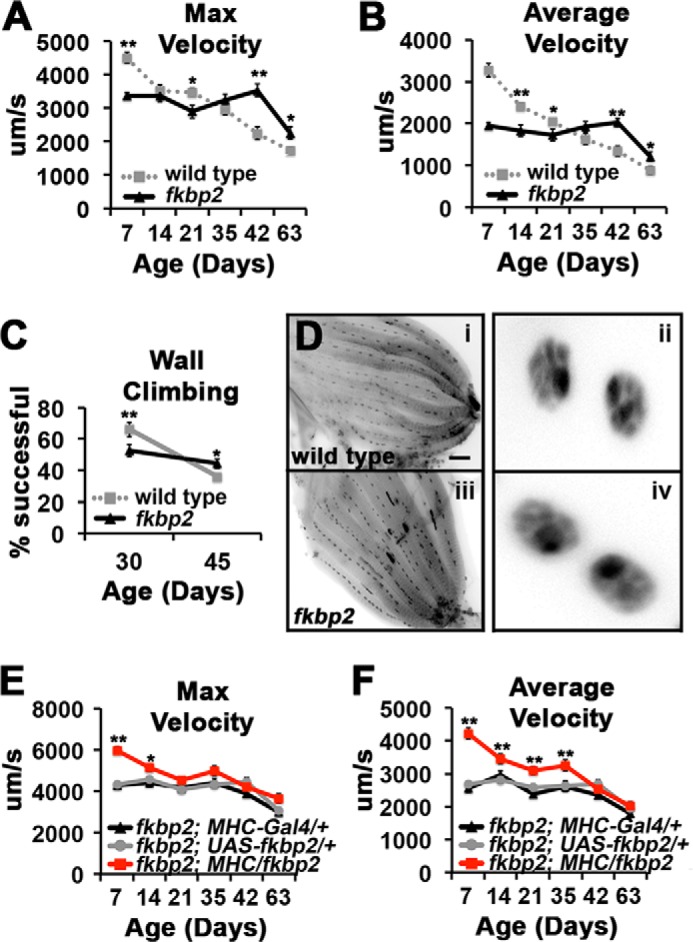
Effects of FK506-BP2 mutants on motor function during aging. A and B, graphs present average value for maximum (A) and average velocity (B) for wild type (gray dotted line, from Fig. 1, C and D) and FK506-BP2 (fkbp2) flies (black line) from 7 to 63 days of age (n = 16–28 events from 8–16 flies). Error bars indicate S.E. Significance was determined by Student's t test of FK506-BP2 versus wild type for each time point. *, p < 0.05; **, p < 0.01. Note that these data were collected in parallel. C, graphs represent the percentage of total number of flies that reach the threshold of 8 cm in 10 s for wild type (gray squares) and FK506-BP2 (fkbp2) flies (black triangles) (n = 120–200 flies/genotype). Error bars indicate S.E. Significance was determined by Student's t test of FK506-BP2 versus wild type for each time point. *, p < 0.05; **, p < 0.01. D, inverted images of CM9 muscle group from 7-day-old wild type (panel i) and FK506-BP2 (fkbp2) flies (panel iii) stained with antibodies to Discs-large and DAPI. Enlarged are representative myonuclei from wild type (panel ii) and FK506-BP2 (fkbp2) (panel iv) fibers. E and F, graphs represent the average values for maximum (E) and average velocity (F) determined from 7 to 63 days of age in FK506-BP2 (fkbp2) mutant flies containing the MHC-Gal4 driver (fkbp2; MHC-Gal4/+; black triangles), the UAS-FK506-BP2 transgene (fkbp2; UAS-fkbp2; gray circles), and FK506-BP2 mutant flies expressing the FK506-BP2 solely in the muscle (fkbp2; MHC/fkbp2; red squares) (n = 30–42 events from 13–21 flies). Error bars indicate S.E. Significance was determined using ANOVA. *, p < 0.05; **, p < 0.01.
