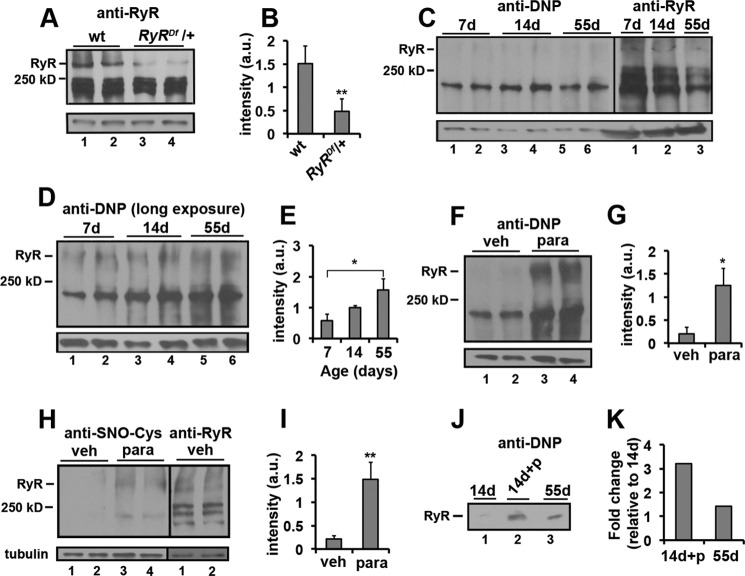
FIGURE 6.
Effects of age and paraquat on oxidation of Drosophila ryanodine receptors. A, immunoblot analysis of wild type (wt; lanes 1 and 2) and RyR/+ (RyRDf; lanes 3 and 4) fly extracts probed with anti-dRyr antibody. B, bar graph represents quantification of the immunoblot in A (n = 4). C, left panel, immunoblot analysis of DNPH-treated proteins from 7- (lanes 1 and 2), 14- (lanes 3 and 4), and 55-day-old (lanes 5 and 6) whole wild type fly extracts probed with anti-DNP antibody. Right panel, immunoblot analysis of 7- (lane 1), 14- (lane 2), and 55-day-old (lane 3) whole wild type fly extracts probed with anti-RyR antibody from the same blot. D, long exposure of DNP immunoblot shown in C. E, bar graph represents quantification of the anti-DNP immunoblot in D (n = 4). F, immunoblot analysis of DNPH-treated proteins from 14-day-old whole wild type fly extracts treated with vehicle (veh; lanes 1 and 2) and paraquat (para; lanes 3 and 4) from 7 to 14 days of age. G, bar graph represents quantification of the immunoblots in F (n = 2). H, left panel, immunoblot analysis of 14-day-old whole wild type fly extracts treated with vehicle (veh; lane 1,2) and paraquat (para; lanes 3 and 4) from 7 to 14 days of age probed with anti-SNO-Cys antibody. Right panel, immunoblot analysis of 14-day-old whole wild type fly extracts treated with vehicle probed with anti-RyR antibody from the same blot. I, bar graph represent quantification of the immunoblot in H (n = 4). J, immunoblot analysis of DNPH-treated proteins from 14-day-old wild type fly extracts treated with vehicle (lane 1) and paraquat (+p; lane 2) and 55-day-old (lane 3) wild type fly extracts immunoprecipitated with anti-RyR antibody. K, bar graph represents quantification of the immunoblot in J (n = 1). Tubulin is shown as a loading control in A, C, D, F, and H. Bar graphs (B, E, G, and I) represent average values for intensity of the RyR band normalized to tubulin. Error bars indicate S.D. Significance was determined using a Student's t test (B, G, and I) or ANOVA (E). *, p < 0.05; **, p < 0.01. d, day.

