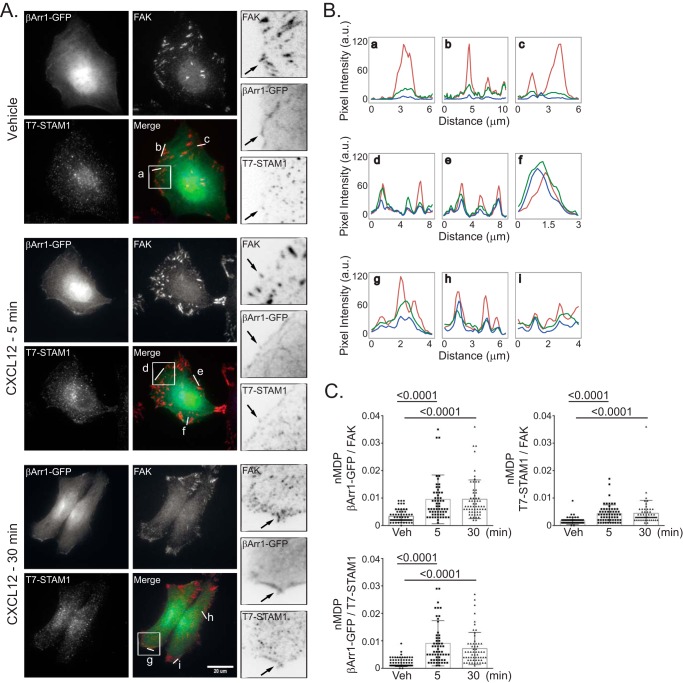
FIGURE 10.
Localization of FAK, β-arrestin1-GFP, and T7-STAM1 by fluorescence microscopy. A, HeLa cells transfected with β-arrestin1-GFP and T7-STAM1 seeded onto coverslips were treated with 10 nm CXCL12 for 5 or 30 min or for 30 min with vehicle. Images were acquired for β-arrestin1-GFP (green), FAK (red), and T7-STAM1 (blue) using identical acquisition settings for parallel samples in each channel. B, the fluorescence intensity profiles of the indicated lines (a–i) within the merged images are shown. C, colocalization analysis among the indicated proteins is shown as nMDP values for 60 ROIs (three independent experiments, five cells per experiment, four ROIs per cell). The error bars represent the S.D. Data were analyzed using one-way ANOVA followed by Tukey's multiple comparison test. p values are provided. Distance per pixel was calibrated to equal 0.156 μm. Scale bar, 20 μm. a.u., arbitrary units.

