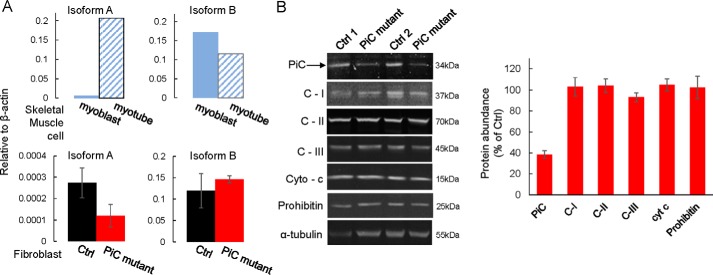
FIGURE 2.
Lower PiC protein expression in primary fibroblasts harboring the compound heterozygous PiC mutation. A, mRNA, as assessed by quantitative PCR analysis, of isoforms A and B was unchanged by the PiC mutant. Ctrl data were obtained from fibroblasts from three normal individuals; PiC mutant data were obtained from two different passages of the fibroblasts expressing the compound SLC25A3 mutation. As controls for identification of isoform A and B mRNA, mRNA was isolated from primary human skeletal myoblasts and myotubes (upper panels); myotubes were expected to show up-regulated PiC-A compared with myoblasts. B, left panels, example of an immunoblot from PiC mutant fibroblasts and Ctrl fibroblasts from two different individuals. Arrow, band used to quantify PiC abundance. Right panel, quantification from Ctrl fibroblasts from four normal individuals (each tested at three different passages) and from five separate passages (less than passage 10) of the PiC mutant fibroblasts. For each genotype, band intensity was first normalized to that of α-tubulin. Data are presented as means, and error bars represent S.E. except for the skeletal muscle cells, which are each from a single sample. C-I, C-II, and C-III, complexes I, II, and III; Cyto-c and cyt c, cytochrome c.

