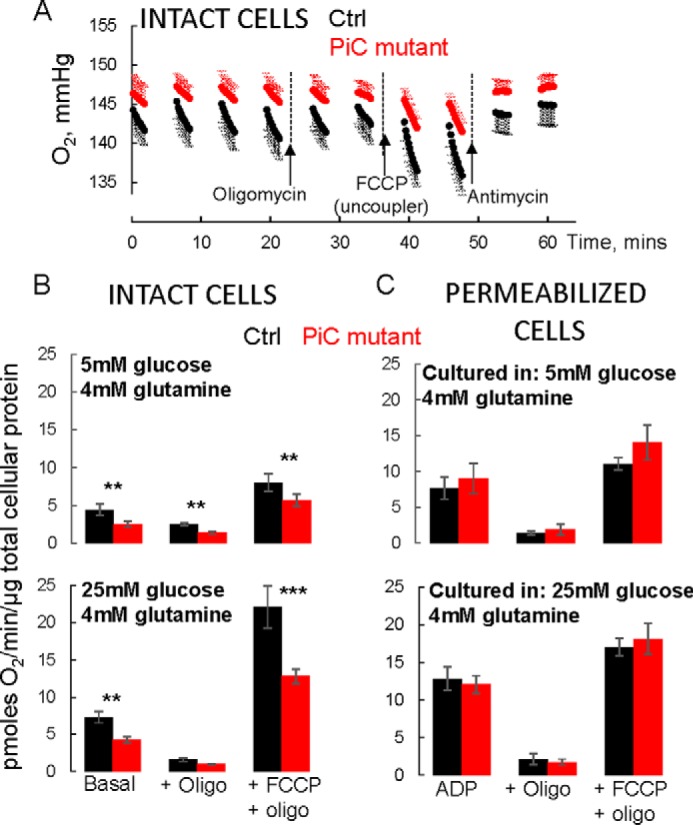
FIGURE 4.

Suppressed bioenergetics in intact but not permeabilized PiC mutant skin fibroblasts. A, raw O2 traces from a single experiment where a Ctrl line and the PiC mutant cells were studied in parallel. Cells were grown and the experiment was performed in 5 mm glucose + 4 mm glutamine as substrates. Values are means ± S.D. with six technical replicates each. Oligomycin (Oligo) was injected to inhibit ATP synthase to measure leak-dependent respiration. Capacity of the electron transport chain under the prevailing substrate condition was determined using the chemical uncoupler FCCP. Finally, antimycin was injected to inhibit the electron transport chain to reveal non-mitochondrial O2 consumption. Note that protein abundance was similar for Ctrl and PiC mutant cells (∼10% higher for mutant cells). B and C, all values are mitochondrial O2 consumption rates calculated by subtracting the O2 consumption rate measured after antimycin. The basal rate is the rate measured in the absence of inhibitors or uncoupler. Cells were grown in the indicated substrate conditions for two to three passages before testing in those conditions. p values are as follows: ***, p < 0.01 from Tukey post hoc test after two-way ANOVA (p = 0.011 for genotype × JO2 condition interaction); **, p = 0.03 from two-way ANOVA (genotype × JO2 condition interaction not significant; p = 0.03 for genotype main effect; p < 0.001 for JO2 condition main effect). C, cells were cultured in the indicated media and then preincubated in those media for 45 min in 0 CO2 before being switched to intracellular medium containing 10 mm pyruvate, 2.5 mm malate, saturating ADP, and a permeabilizing reagent (see “Experimental Procedures” for further details). Permeabilization was confirmed by showing robust succinate-driven O2 consumption; succinate does not cross the plasma membrane (not shown). Data were normalized to total cellular protein from parallel plates of intact cells. n = 3/genotype from cells at different passages (less than passage 10). In B and C, data are presented as means, and error bars represent S.E. For the 5 mm glucose condition, n = 4/genotype from cells at different passages (less than passage 10). For the 25 mm glucose condition, four separate Ctrl fibroblast lines were tested, each in triplicate (three different passages); triplicates were averaged. Data from PiC mutant cells were split into parallel cultures for the different controls and then tested at three different passages each. Thus, n = 4/genotype for 25 mm glucose.
